In a year that changed nearly everything, healthcare professionals and organizations across the Surescripts Network Alliance® reimagined care delivery to keep patients safe during a pandemic. Throughout it all, they accelerated the digital transformation of healthcare. Explore the progress we made together and the innovations that made it possible.
A Letter from Our CEO
Collective innovation in extraordinary times
It’s hard to overstate the demands 2020 made on American healthcare. No stranger to disruption, the industry had to reshape itself faster than ever to battle the COVID-19 pandemic (which has claimed more than 530,000 U.S. lives so far) and devise new ways to deliver care in a changed world.
It wasn’t easy. During the first peak of the pandemic, ambulatory care visits declined nearly 60%.1 Many U.S. patients—including 36% of nonelderly adults and 29% of children—delayed or skipped care due to exposure concerns or service limitations tied to COVID-19.2, 3 By year’s end, 8% of U.S. physician practices—around 16,000—had closed for good.4
The Surescripts Network Alliance faced these demands with intense collaboration and innovation. While tackling the pandemic head on, participants across the Network Alliance accelerated the digital transformation of healthcare to carry us toward the goal we’ve always pursued: better, safer, more cost-effective care. In 2020, we saw especially profound impacts in three areas:
-
Powering Care Management and Public Health Programs with Interoperability
Health data exchange in the U.S. is a work in progress. As recently as 2017, 26% of physicians said they did not receive hospital discharge summaries in time for most follow-up appointments.5 But longstanding information-sharing challenges became especially urgent as reliance on fax machines caused bottlenecks in COVID-19 case tracking.6
In 2020, the Surescripts Network Alliance mobilized technology in new ways to make COVID-19 case reporting more efficient. Meanwhile, we continued expanding interoperability to fulfill the potential of care management and value-based care programs, bringing timely patient insights into focus for clinicians and organizations across the country.
-
Helping Optimize Prescriptions for Affordability and Adherence
Patients increasingly expect to know the cost of their medications before it’s time to pay, and tools like drug discount cards and online comparison sites have sprung up to serve them.
But access to cost and coverage information is most powerful when it’s part of the initial prescribing conversation. Nearly all patients (94%) who’ve skipped a medication due to cost say they would have been willing to take a lower-cost alternative if their doctor or nurse had suggested one.7 One in five would even consider switching doctors in order to have cost conversations at the point of care.8
Fortunately, healthcare providers are increasingly aware that medication only works if patients can access, afford and adhere to it. So in 2020, the Surescripts Network Alliance put prescription price transparency to work for more patients, prescribers and pharmacy staff across care settings.
-
Remapping the Specialty Medication Journey
With high costs and extensive documentation requirements, specialty prescriptions are complex—so complex that it’s hard to handle them efficiently via faxes, phone calls and paper forms. On average, providers spend more than three hours a week on paperwork (not including charting) in order to start patients on specialty medications.9
Nearly 40% of providers say it takes one to two weeks to get the average patient started on a new specialty drug.10 Beyond the impact on treatment outcomes, inefficiencies like these add fuel to an epidemic of burnout that was worsening for 64% of U.S. physicians surveyed in 2020.11 And 73% of pharmacists said their stress levels rose in 2020, with 79% reporting increased workload as a factor and 37% specifically blaming increased paperwork.12
In 2020, the Surescripts Network Alliance pioneered new ways to navigate this complexity more effectively. Together, we’re transforming the specialty medication journey so patients get these essential medications sooner, with less work for everyone involved.
As a brighter future comes into view—and as Surescripts marks 20 years of delivering actionable patient intelligence where it’s needed most—I look back with enormous pride at all the Surescripts Network Alliance accomplished in such a consequential year. Read on to explore exactly how we reduced patient safety risks, saved time, lowered costs and enabled higher-quality care across the nation in 2020.

NETWORK ALLIANCE
DELIVERING ACCURACY AND INTEGRITY AT SCALE
The Surescripts Network Alliance connects virtually all electronic health record (EHR) vendors, pharmacy benefit managers (PBMs), pharmacies and clinicians, plus an increasing number of health plans, long-term and post-acute care organizations, specialty hubs and specialty pharmacy organizations.
- 2 million healthcare professionals and organizations connected (+11.8% in 2020)
- 324 million patients in our master patient index, representing 98% of the U.S. population*
- 0.04 seconds to return a patient match on average via Surescripts’ proprietary matching algorithm
*Includes patient data provided by pharmacies and PBMs, adjusted to account for duplicate records and patients with multiple coverage.
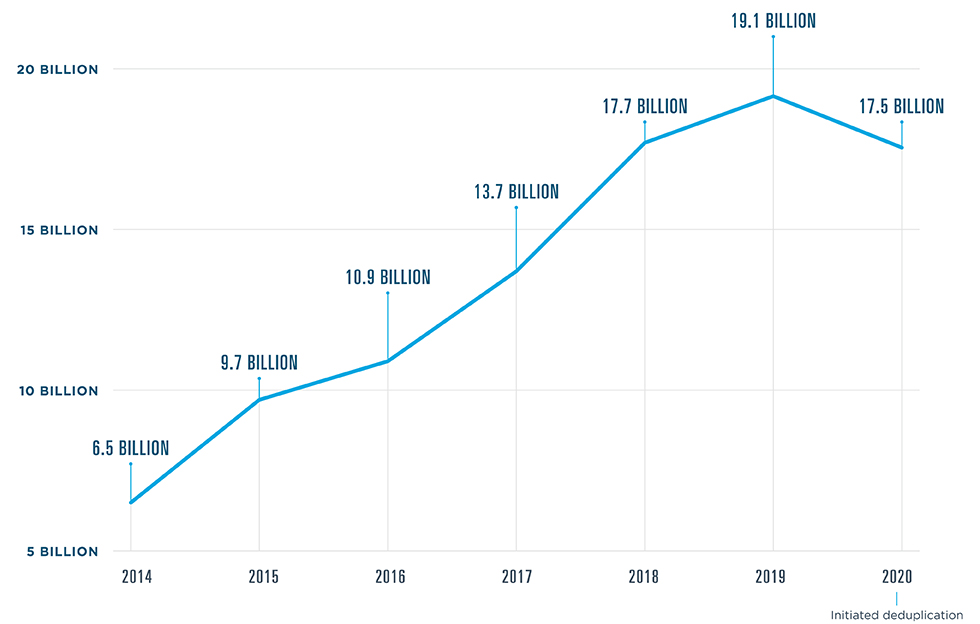
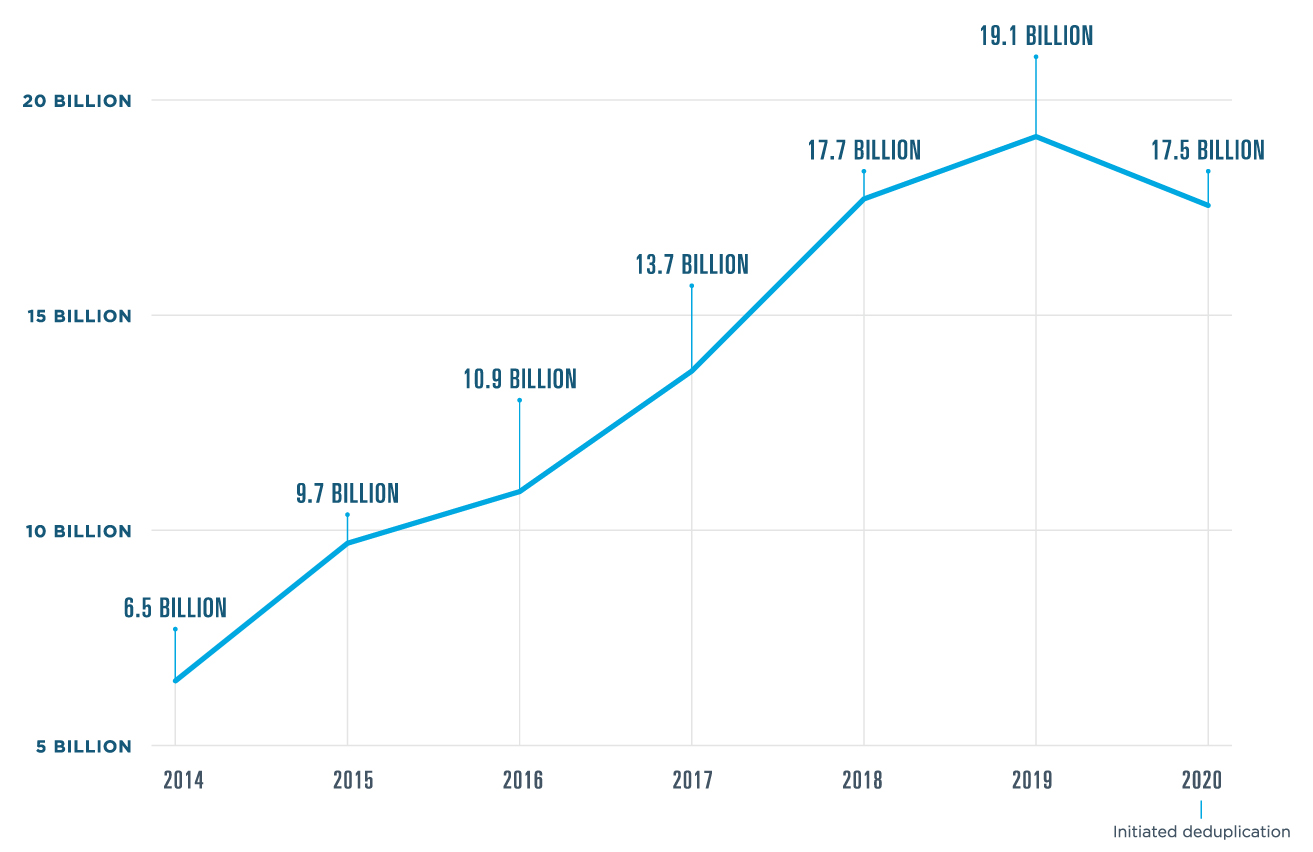
High Transaction Volume, High Data Quality
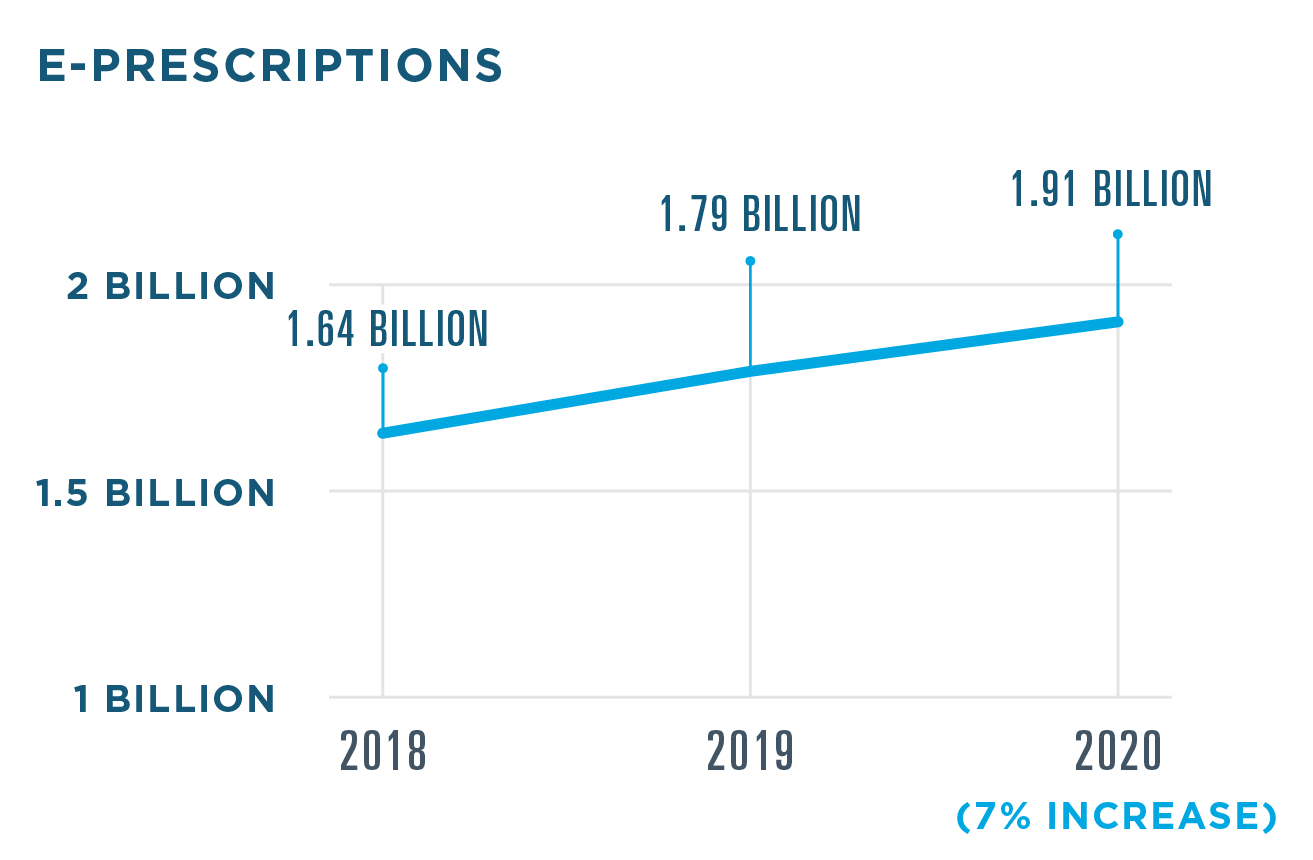
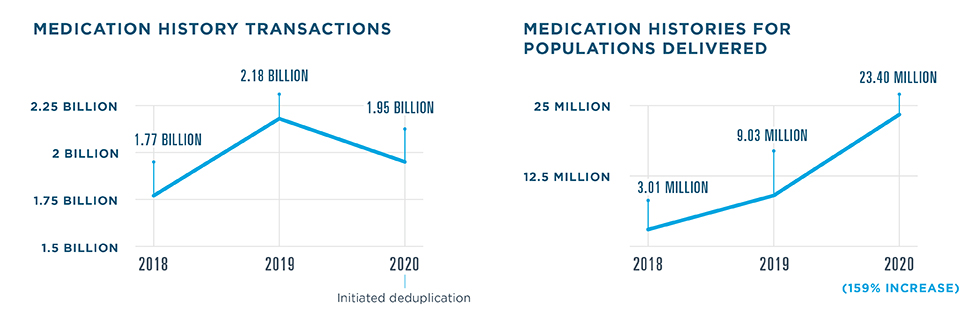
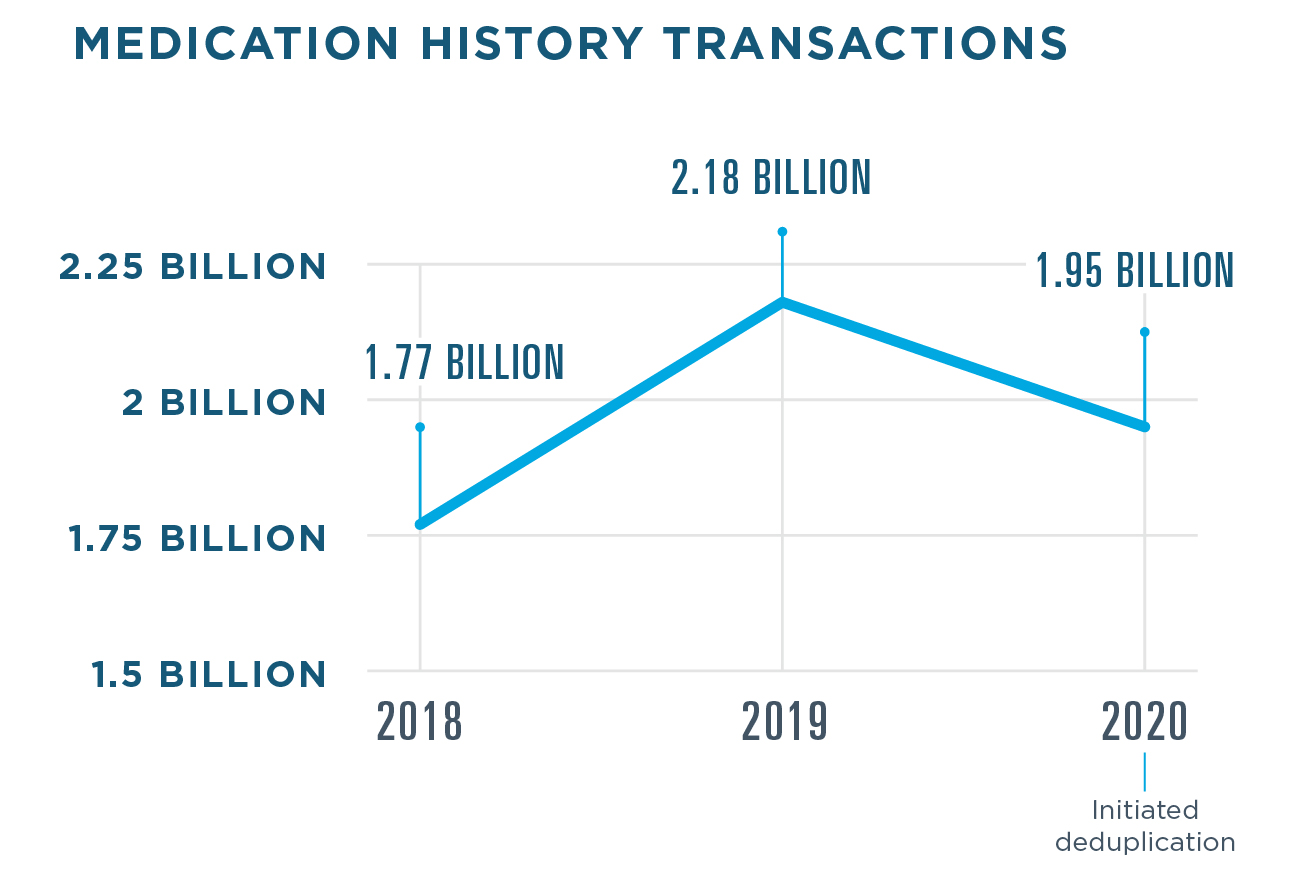
In 2020, Surescripts processed 17.5 billion transactions—a slight decrease from 2019 due to network improvements and optimization. Broader adoption of the National Council for Prescription Drug Programs (NCPDP) SCRIPT standard v2017071 for Medication History, which includes message and medication deduplication, had a particularly strong effect.
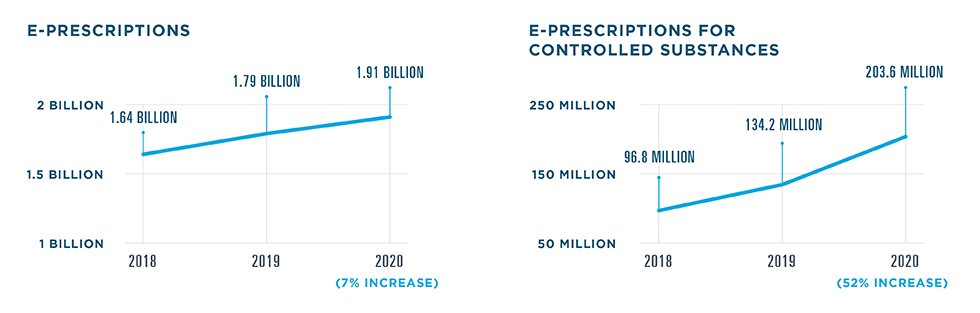
- 1.91 billion e-prescriptions filled (+7% in 2020)
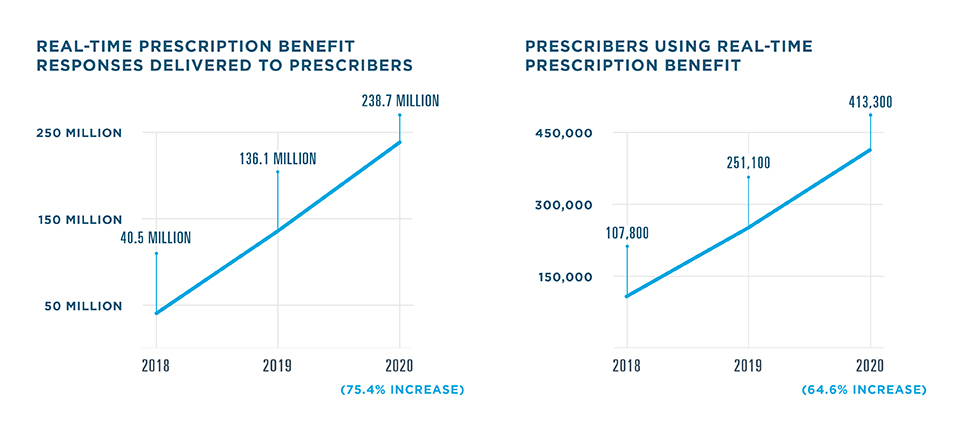
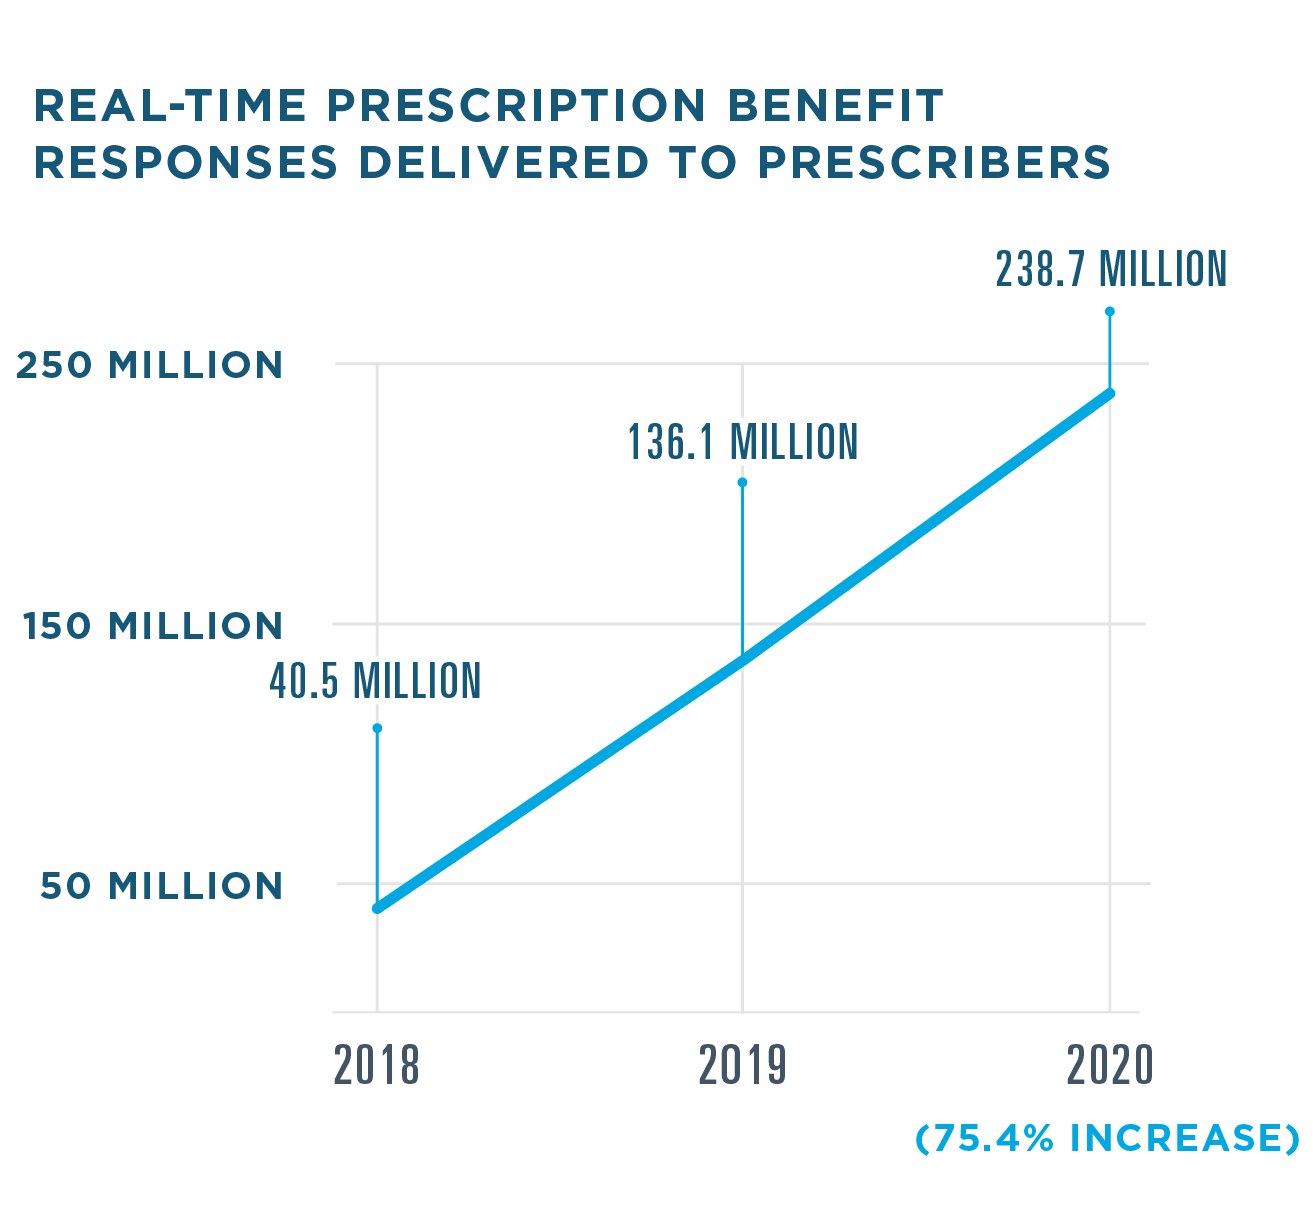
- 238.7 million Real-Time Prescription Benefit responses delivered to prescribers (+75% in 2020)
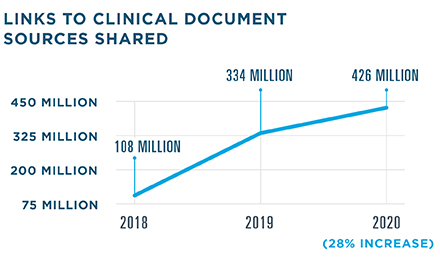
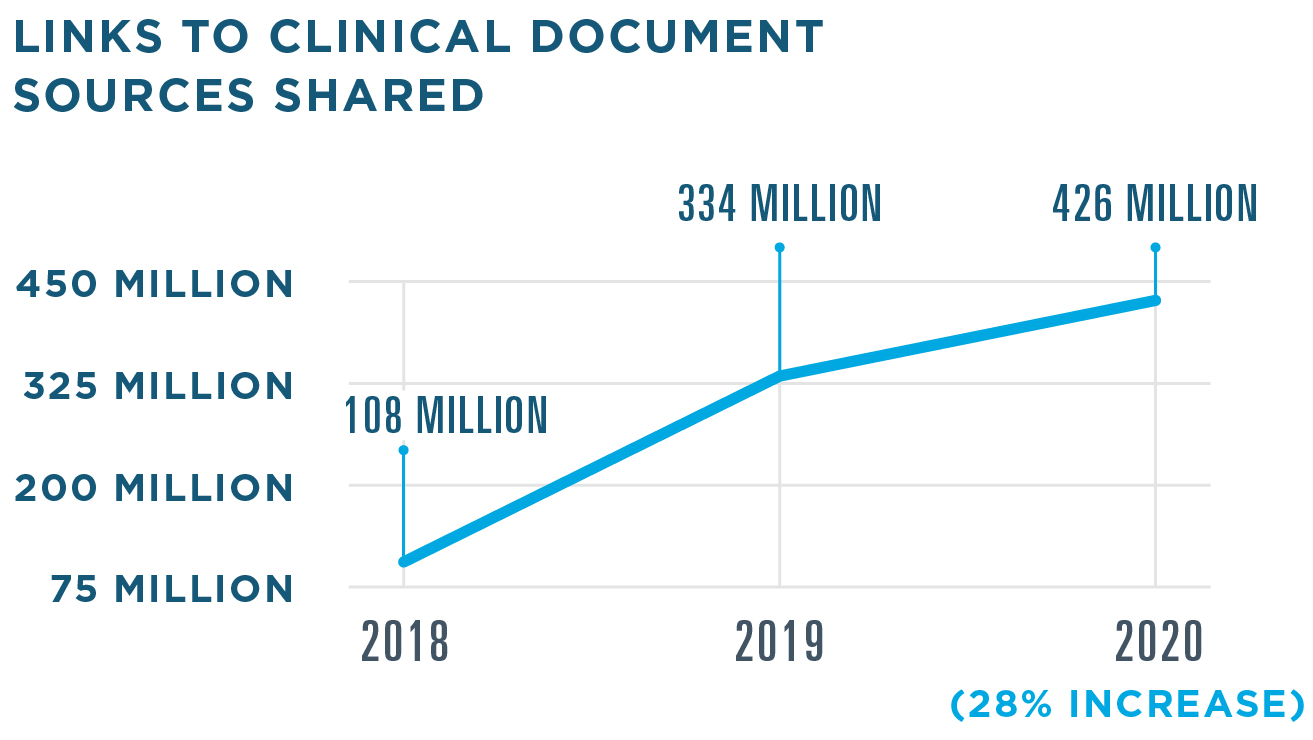
- 426 million links to clinical document sources shared (+28% in 2020)
Protecting Network Integrity
Throughout 2020, Surescripts continued to protect and improve the privacy, security and performance of our network and the actionable patient intelligence it carries.
99.99% approximate uptime for the Surescripts network
HITRUST CSF Certified status maintained for key platforms within Surescripts solutions, placing Surescripts in an elite group of organizations worldwide
11% improvement in Surescripts Quality Index Score (QIS) for electronic prescriptions across the network, including the doubling of EHR adoption of the Structured & Codified Sig field (from 5.05% to 10.72%)
QIS tracks factors that impact the e-prescribing process, including prescription accuracy and directory alignment as well as adoption of appropriate transactions and data elements such as RxChange, Structured & Codified Sig and National Drug Code (NDC) identifiers. In 2020, we added additional measures including use of the Notes and Days Supply fields, which help clarify prescriber intent.
Honoring Progress In Prescription Accuracy
Surescripts first convened the Critical Performance Improvement program in 2016 with a common goal: to increase prescription accuracy across the Surescripts Network Alliance. All electronic prescriptions processed by Surescripts, except those for compounds and supplies, are analyzed by the Surescripts Sentinel® e-prescription accuracy engine, which identifies opportunities for improvement.
The Surescripts White Coat Award celebrates pharmacies, health systems, EHR vendors and pharmacy technology vendors working to improve e-prescription accuracy. In 2020, we recognized 10 organizations with the Surescripts White Coat Award in three categories, including Highest Accuracy and two new categories: RxChange Champion and Structured & Codified Sig Champion.
-
2020 WHITE COAT AWARD WINNERS
athenahealth, Inc.
Hartford HealthCare
Henry Schein
MicroMD
Hospital Sisters Health System
Lincare, Inc.
MidMichigan Health
Montage Health
NewCrop
Office Ally
Walmart
Moving Industry Standards Forward
When the COVID-19 pandemic shifted priorities and operations across the Surescripts Network Alliance, another transformation was already well underway: migration to NCPDP SCRIPT standard v2017071. Given the need to focus on the COVID-19 pandemic, we pushed back our sunset date for SCRIPT v10.6 E-Prescribing, Medication History and Directories versions prior to 6.1 to September 1, 2021. Throughout 2020, Surescripts continued to provide consistent and reliable technical support as network participants worked to meet the regulatory compliance deadline and our September 1, 2021 sunset date for SCRIPT v10.6 E-Prescribing, Medication History and Directories versions prior to 6.1. As of the end of 2020, the majority of impacted transactions processed through the Surescripts network were compliant with SCRIPT standard v2017071.
ENHANCE PRESCRIBING
OPTIMIZING PRESCRIPTION SAFETY, COST AND SPEED
ELIGIBILITY & FORMULARY
Eligibility & Formulary delivers plan-level prescription benefit coverage and formulary information to prescribers at the point of care. This important solution serves as the foundation for E-Prescribing, Real-Time Prescription Benefit, Electronic Prior Authorization, Medication History and Record Locator & Exchange.
- Used by nearly 2 million healthcare providers to inform more than 3.23 billion care events
New research in 2020 helped illuminate exactly how and where patient benefit data adds value to electronic prescribing. Surescripts analyzed all e-prescriptions sent to a large chain pharmacy in November 2019 and assessed whether they had a matching Eligibility response, indicating that an eligibility check was performed. Then, researchers analyzed pharmacy fill data for those prescriptions within 90 days of prescribing to assess the impact of Eligibility on pickup rates.
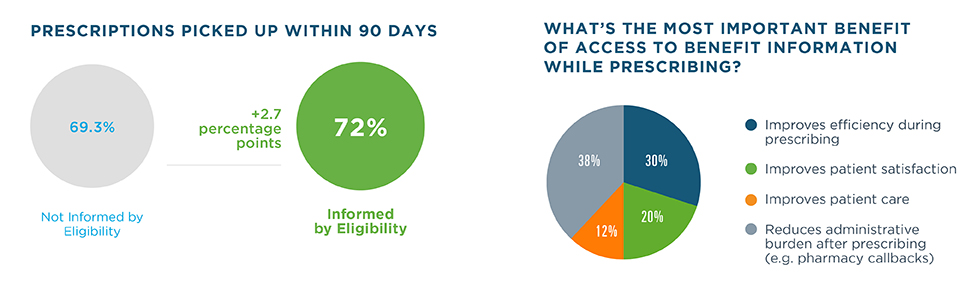
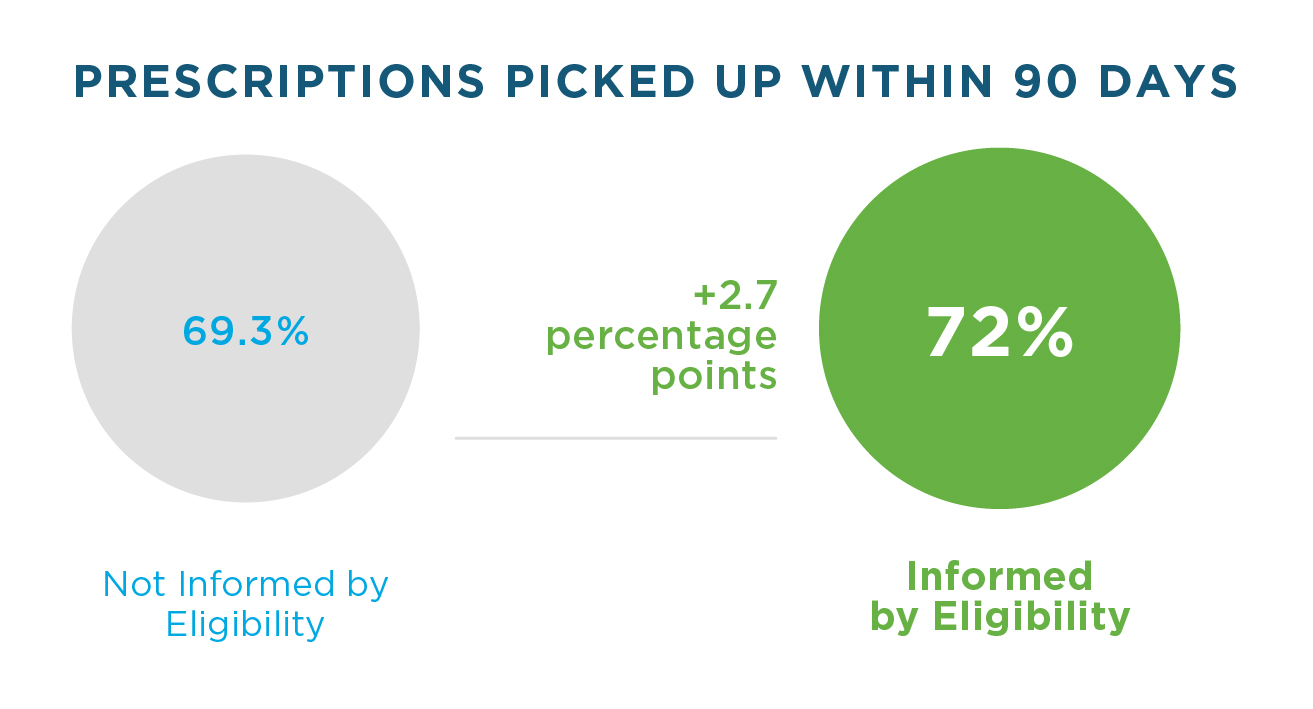
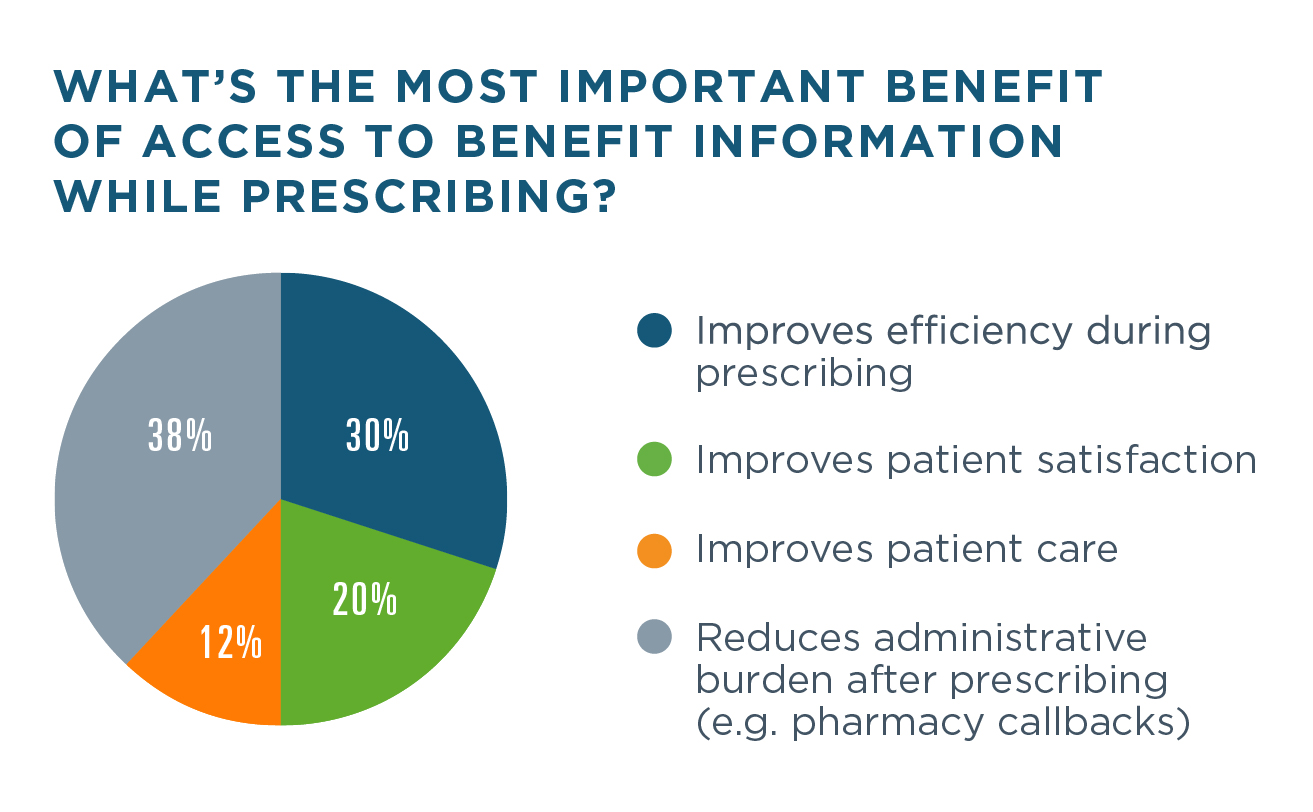
Separately, Surescripts surveyed 300 healthcare professionals involved in patient care or the pharmacy benefits process to further understand the value of benefit information within the e-prescribing workflow. Prescription data and survey responses both demonstrate the impact these insights have on prescribing efficiency and medication adherence.13
- 90% of respondents refer to the patient’s formulary information within the EHR.
- 64% of respondents find access to group/plan-level prescription benefit information very or extremely valuable in the e-prescribing workflow.14
E-PRESCRIBING
A critical tool for increasing medication adherence and reducing prescription fraud, E-Prescribing enables safer and more efficient electronic prescription management across care settings.
E-Prescribing became especially important during the COVID-19 pandemic, as more clinicians began delivering care virtually. Data from a sampling of telehealth vendors revealed that the weekly volume of e-prescriptions written via a telehealth platform peaked the week of March 29, 2020—a 72.5% increase from the week of February 23.
E-PRESCRIBING UTILIZATION AMONG PRESCRIBERS
The number of prescribers utilizing E-Prescribing increased more than 6% in 2020.
ACTIVE E-PRESCRIBERS BY MONTH

The number of prescribers using E-Prescribing increased by more than 63,000 in 2020, surpassing 1 million prescribers for the first time. They joined virtually all pharmacies in making this solution a part of their everyday workflow.
TOP 10 SPECIALTIES USING E-PRESCRIBING
In 2020, emergency medicine and rheumatology moved into the top 10 specialties using E-Prescribing most widely. Psychiatry also climbed the ranks, moving from ninth place into fourth.


RATE OF E-PRESCRIBING


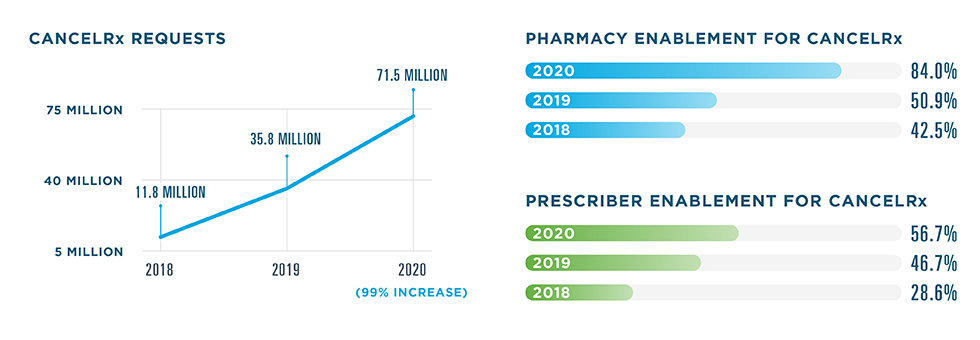
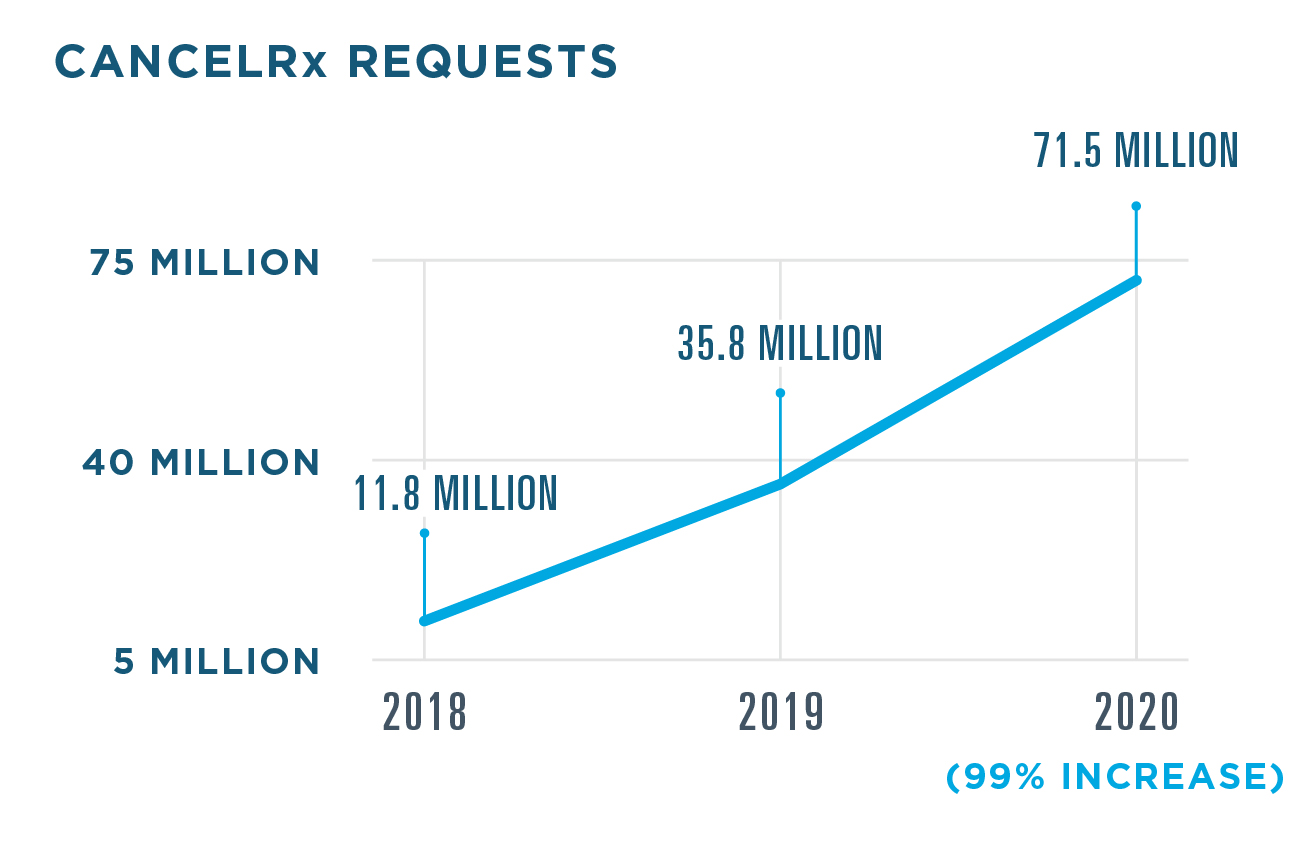
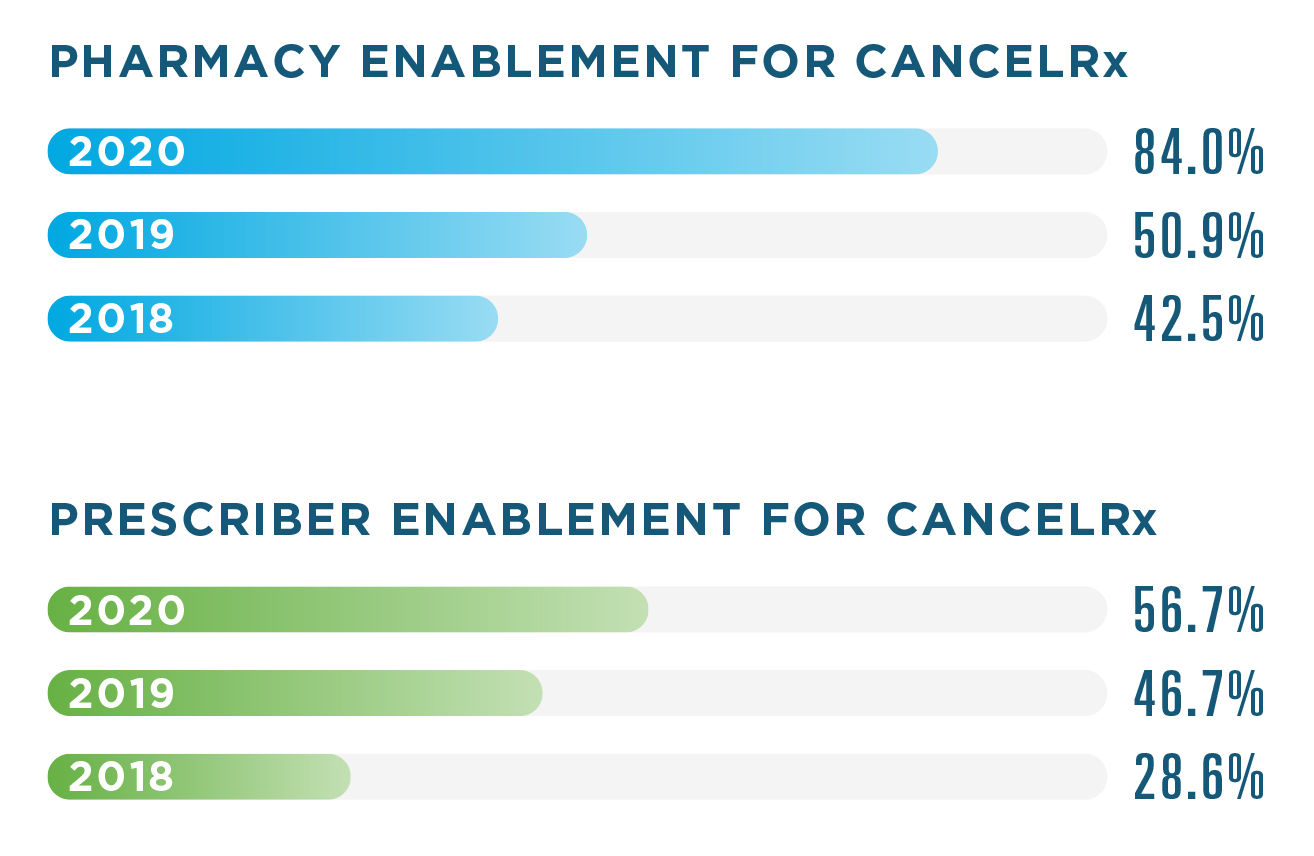
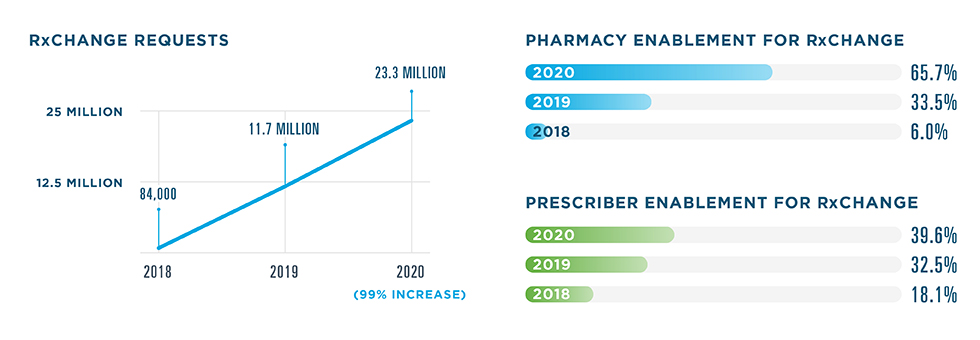
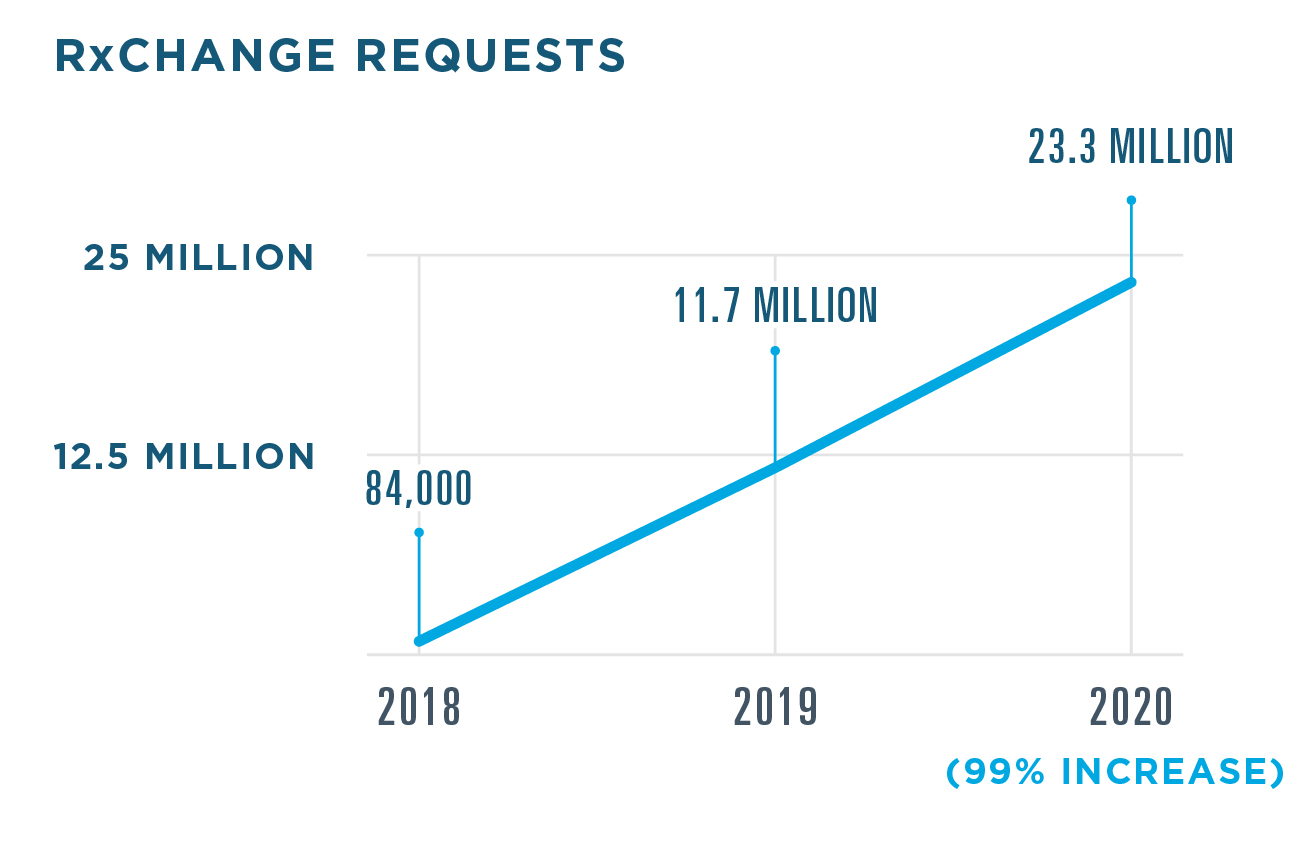
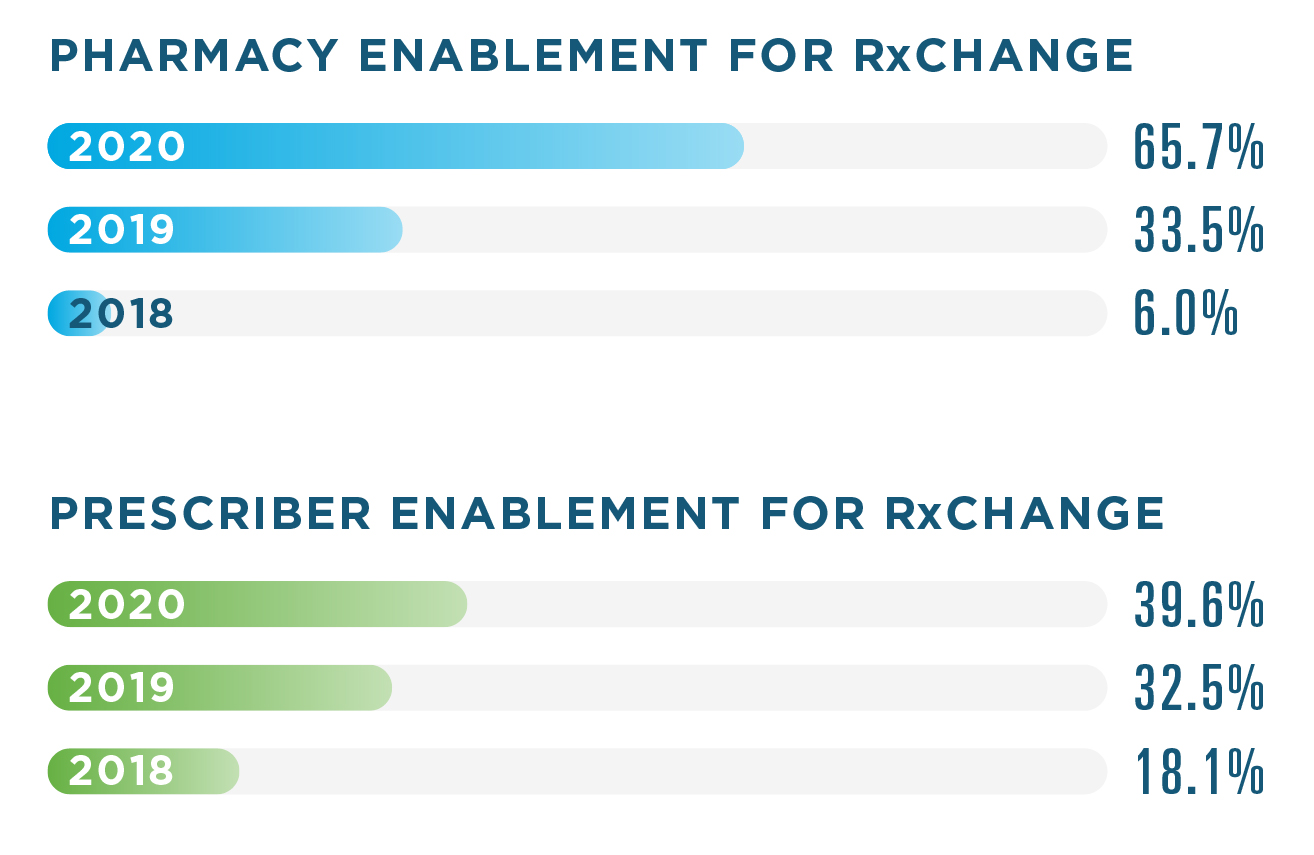
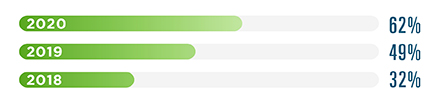
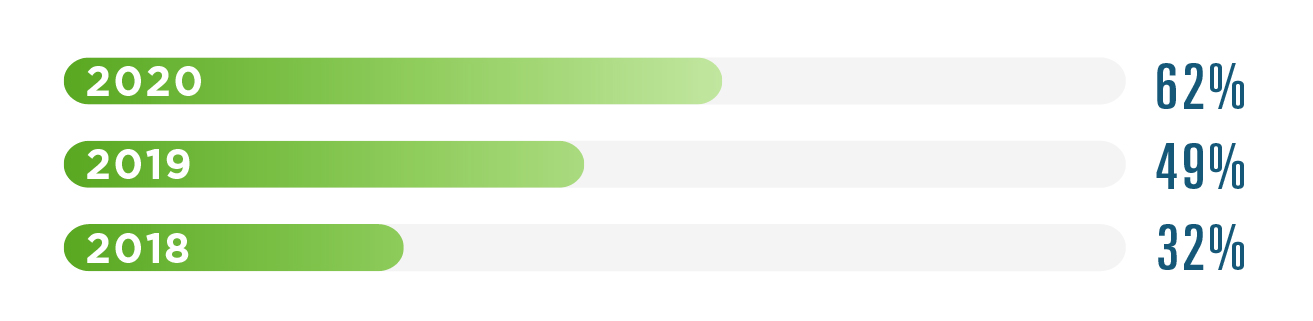
IMPROVING THE E-PRESCRIBING WORKFLOW WITH CANCELRx & RxCHANGE
The Surescripts Network Alliance continued to optimize e-prescribing in 2020 with significant increases in the adoption and utilization of CancelRx and RxChange—two transactions that streamline communication between prescribers and pharmacists by making it easy to cancel a prescription or suggest an alternative electronically, as well as request a prior authorization.
ELECTRONIC PRESCRIBING FOR CONTROLLED SUBSTANCES (EPCS)
EPCS integrates into existing technology platforms and workflows to offer new dimensions
of safety and security for controlled substance prescriptions.
PRESCRIBERS ENABLED FOR EPCS
By the end of 2020, virtually all pharmacies were enabled for EPCS. Over the course of the year, the number of enabled prescribers grew 30%.
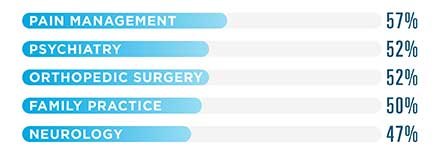
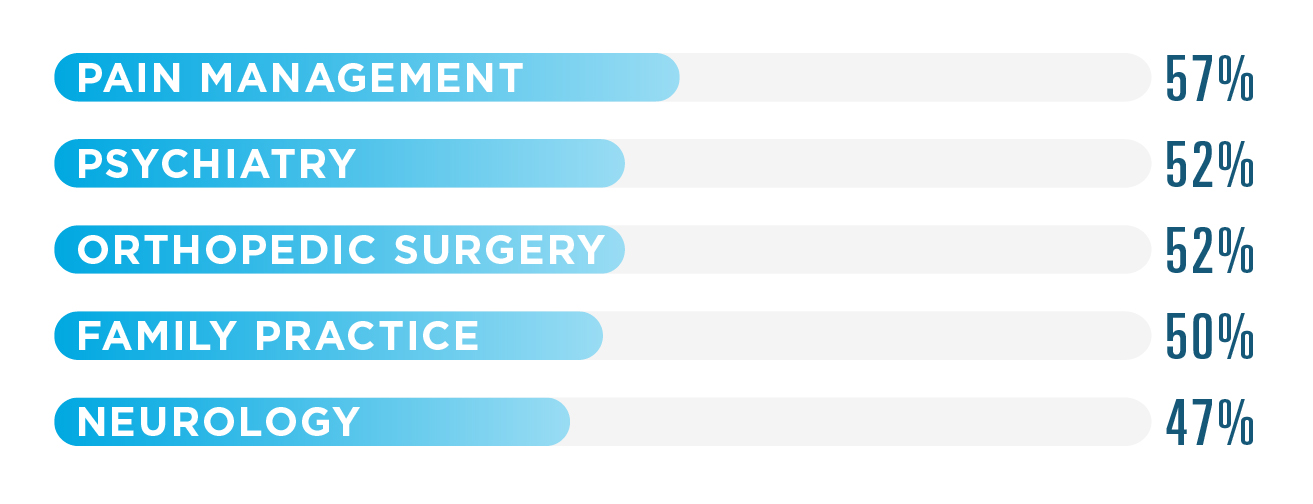
TOP 5 SPECIALTIES USING EPCS
All specialties increased their EPCS utilization by at least 10 percentage points in 2020. Pain management saw the largest increase with a jump of 17 percentage points.
EPCS LEGISLATION ACROSS THE U.S.
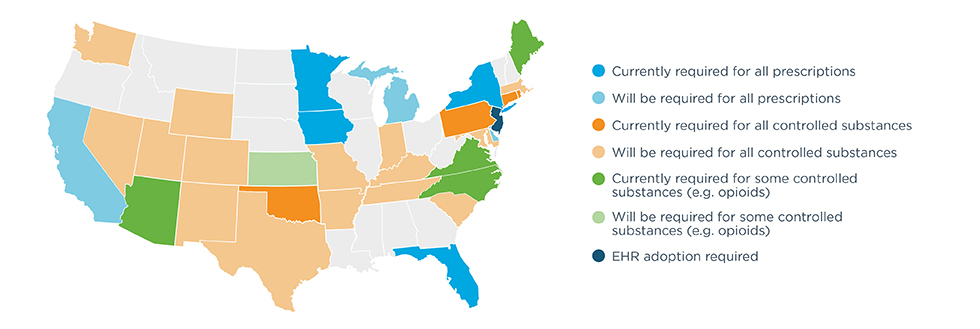
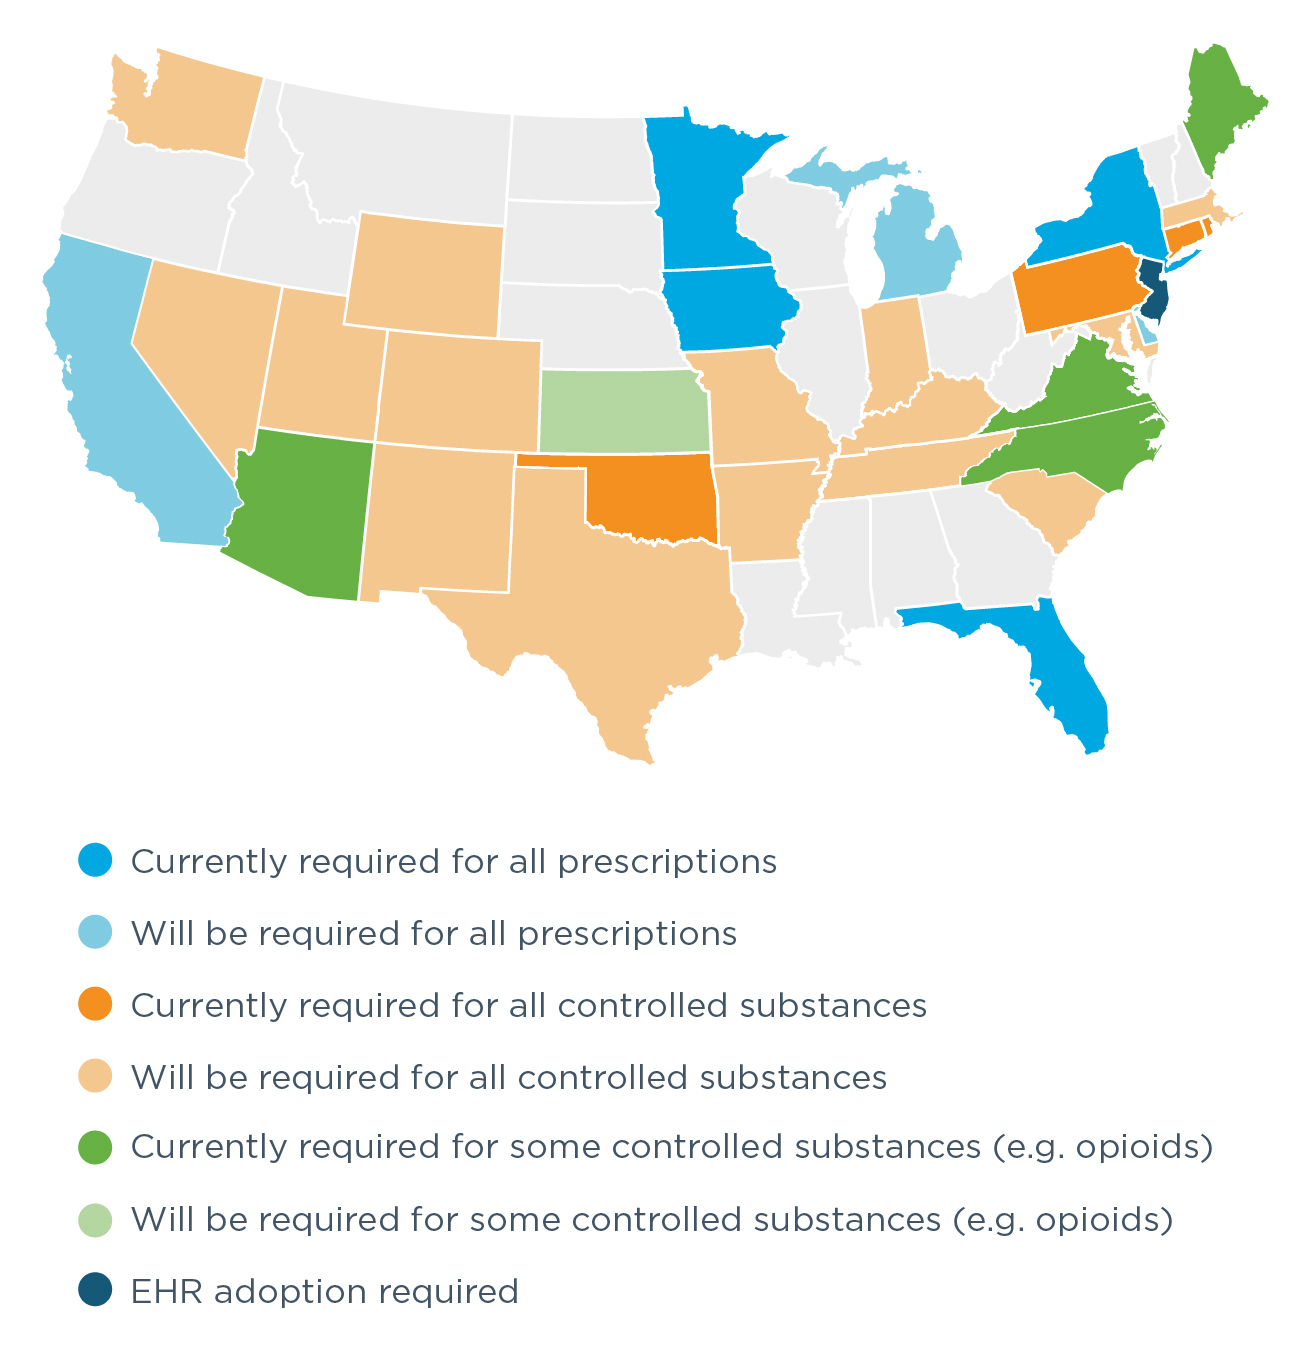
State and federal legislation mandating the use of electronic prescribing continued to drive prescriber enablement in 2020. In December, the Centers for Medicare & Medicaid Services (CMS) issued a final rule requiring that Medicare Part D providers use EPCS effective January 1, 2021, pursuant to the requirements of the SUPPORT Act.15
Meanwhile, four states enacted e-prescribing requirements in 2020, bringing the total number of states with legislation requiring e-prescribing for opioids, controlled substances or all prescriptions to 32. In addition, seven states had e-prescribing requirements go into effect in 2020, making a total of 13 states with requirements in effect.
WHERE IS E-PRESCRIBING REQUIRED BY LAW?
EPCS STATE RANKINGS
Each year, Surescripts ranks each state according to three criteria: pharmacy enablement, prescriber enablement and percent of controlled substances e-prescribed. The ranking is based on an average of each state’s scores for the three criteria.
| 2020 Rank | 2019 Rank | State | Pharmacy Enablement | Prescriber Enablement | Controlled Substances Prescribed Electronically* |
|---|
New York and Maine continued to hold their positions as first and second in the nation.
Virginia saw the largest rank increase in the country, moving up 22 spots to 12th place. Its requirement took effect in July.
Mandates effective January 2020 drove gains in several states, including North Carolina, Iowa and Arizona, which moved to ranks 3, 4 and 5. In fact, North Carolina claimed the highest prescriber enablement rate in the nation.
Delaware moved up from 27th to 19th, becoming the first state with 100% of pharmacies enabled.
Oklahoma moved up 12 spots to sixth place, sending nearly 84.8% of controlled substance prescriptions via EPCS. Rhode Island rose from 17th place to seventh.
Washington also jumped up 10 spots with 55% of controlled substance prescriptions sent via EPCS. Although the state’s e-prescribing mandate had an original compliance date of January 1, 2021, the deadline was extended to September 30, 2021, due to the COVID-19 pandemic.
TRACKING EPCS PRESCRIBER ENABLEMENT
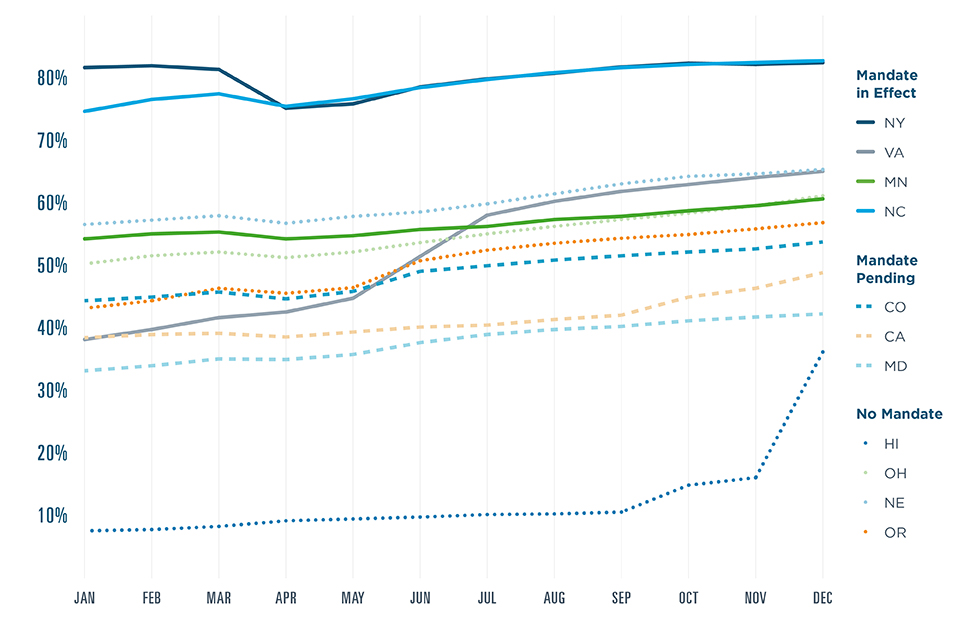
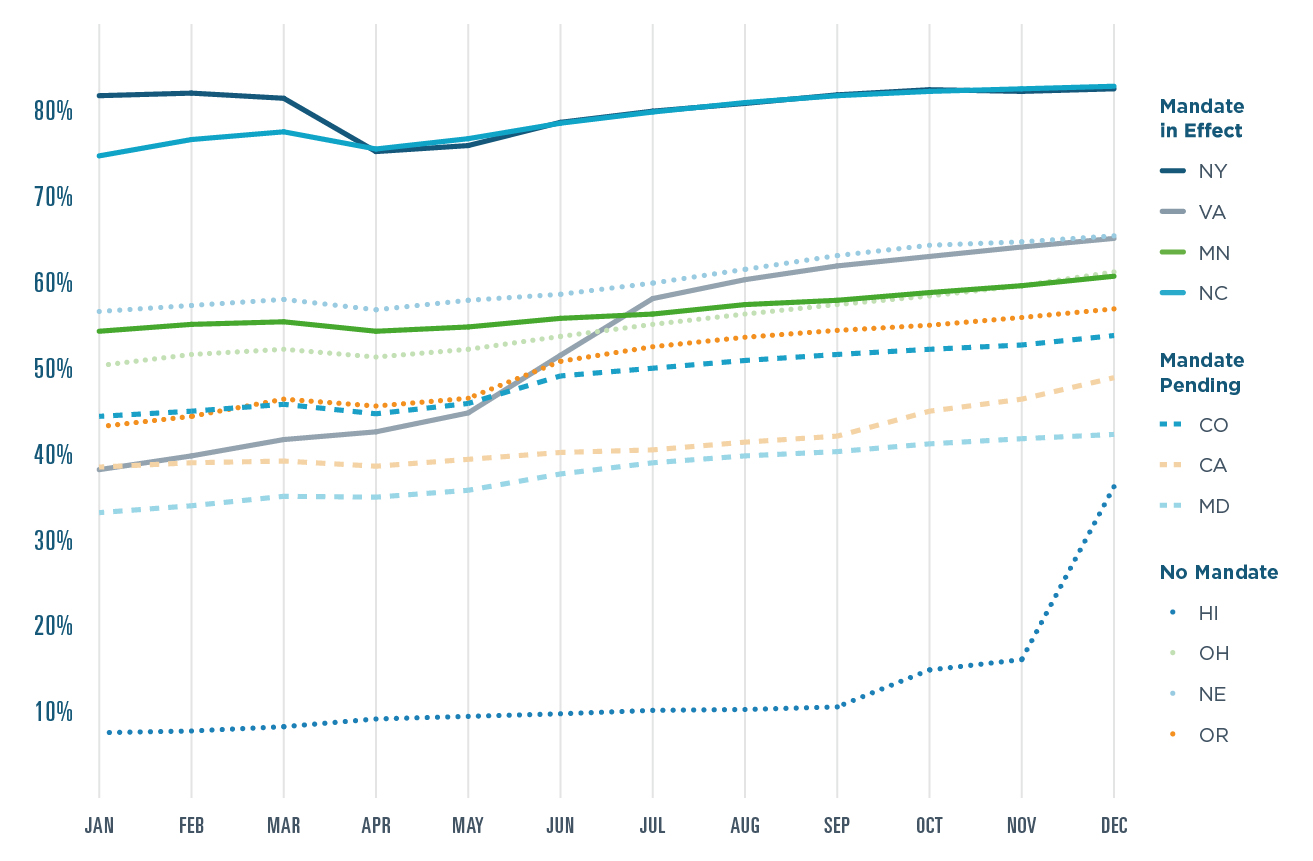
Although EPCS legislation has proven powerful, state-level trends in 2020 suggest that prescriber enablement is increasing even in states without mandates. Prescriber enablement in Nebraska, Ohio, and Oregon—three states without mandates—surpassed several states where mandates are pending. EPCS adoption by several large health systems likely drove increases in Ohio and Hawaii. Prescriber enablement in Hawaii surged from 7.6% to 36.2% despite the lack of a state mandate.
ELECTRONIC PRIOR AUTHORIZATION
Surescripts continued to improve the prior authorization experience in 2020 by streamlining workflows and expanding the network to include new data suppliers.
- 98% of U.S. patients covered by contracted health plans and PBMs
- 83% of U.S. prescribers served by EHRs enabled for the service
- 43.2% increase in prior authorizations processed electronically
- 7.6% more prescribers using Electronic Prior Authorization
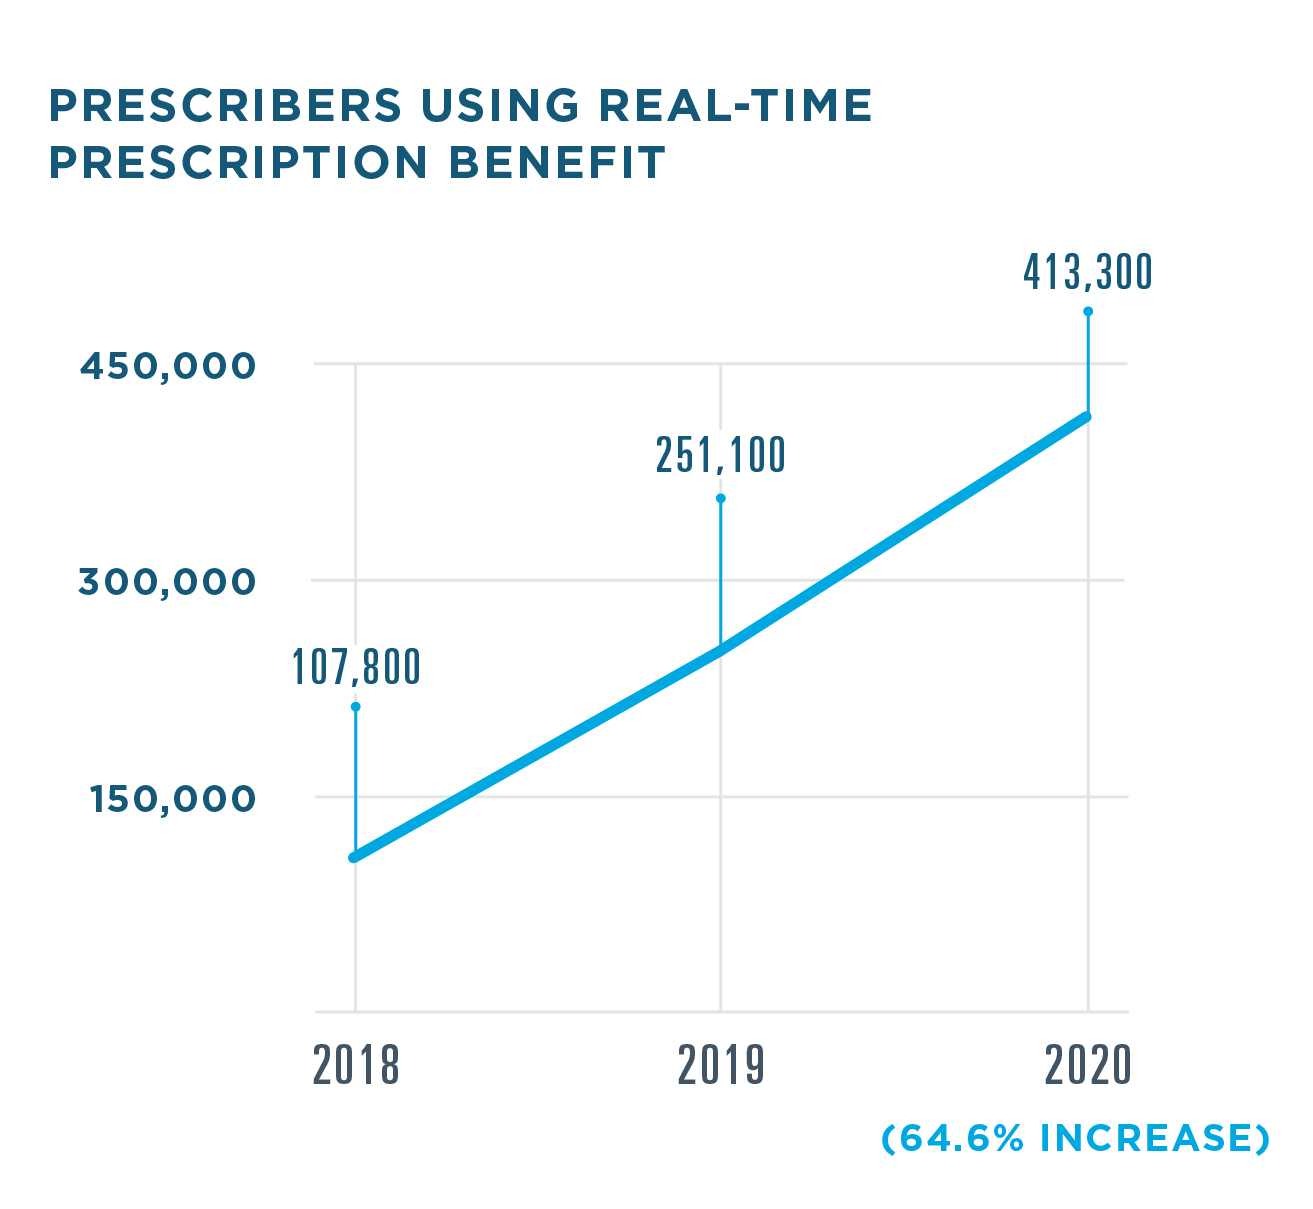
REAL-TIME PRESCRIPTION BENEFIT
Real-Time Prescription Benefit delivers patient-specific benefit and cost information at the point of prescribing and the pharmacy,
empowering clinicians to address cost concerns and support better medication adherence. Use of Real-Time Prescription Benefit among prescribers increased significantly in 2020.
- 82% of U.S. patients covered by contracted health plans and PBMs
- 95% of U.S. prescribers served by EHRs enabled for the service
- <1.5 seconds average time to receive cost and coverage information in the e-prescribing workflow
AVERAGE SAVINGS PER PRESCRIPTION WHEN A LOWER-COST ALTERNATIVE IS CHOSEN
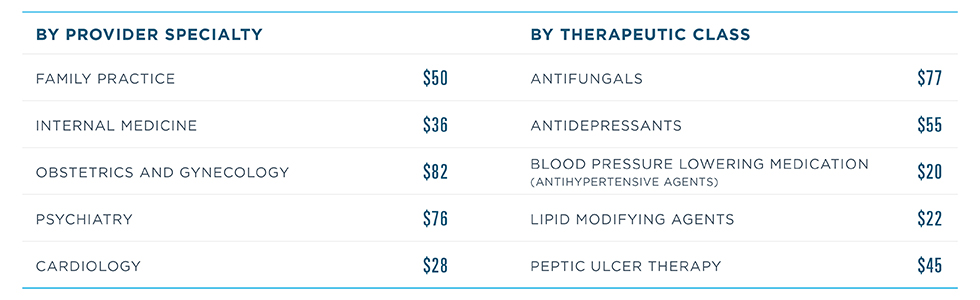


In 2020, Real-Time Prescription Benefit became available for pharmacies, helping patients benefit from cost and coverage insights at every step of their care journey. One independent pharmacy owner who adopted the solution was Priyank Patel, owner of three pharmacies in New York City. The impact was significant:
- Medication pickup rates increased to nearly 90%, up from 60–70%.
- Processing time for prescriptions with cost concerns dropped 75%, averaging 5 minutes compared to 20 minutes.16
“With the push of a single button, our staff now has immediate access to each patient's benefit information. Information that used to require multiple steps and several minutes to gather now appears right away.”
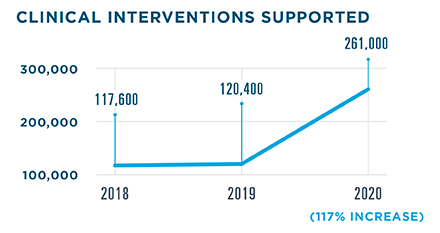
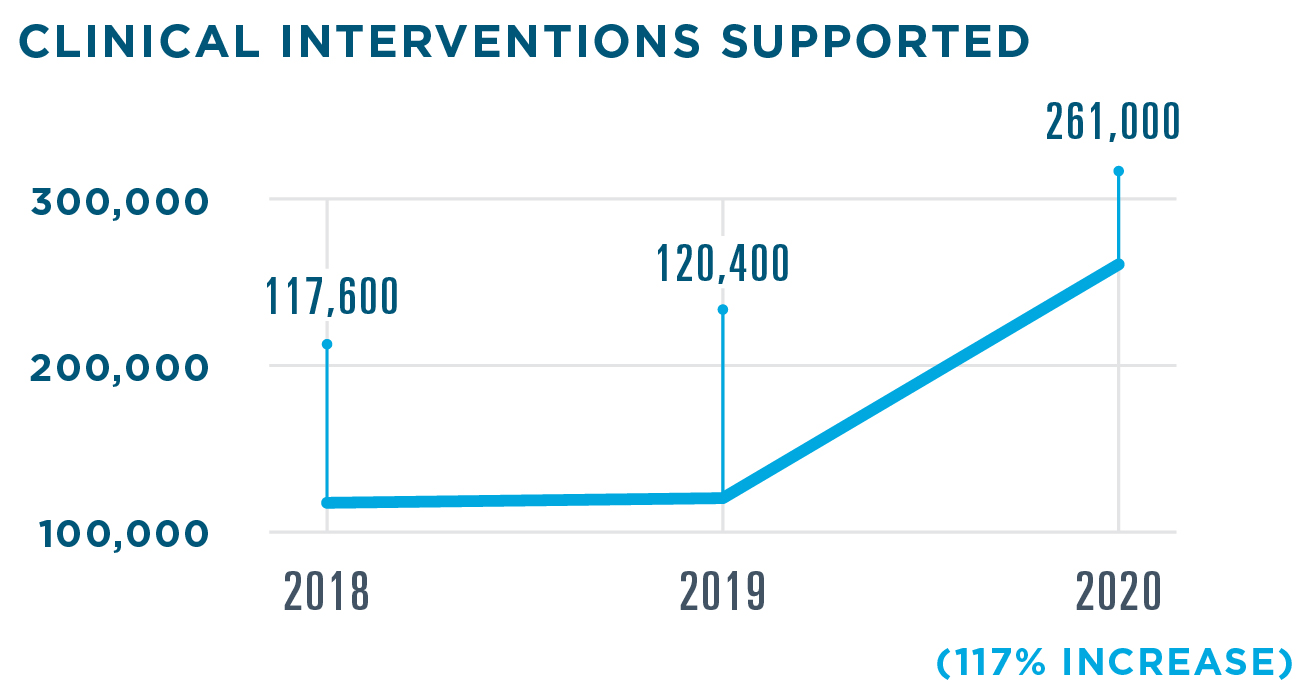
SPECIALTY PATIENT ENROLLMENT
By adopting technologies like Specialty Patient Enrollment, the Surescripts Network Alliance worked to automate the specialty prescribing and fulfillment process and reduce time to therapy in 2020.
- 214.5% increase in prescribers enabled
- 167% increase in specialty hubs contracted
- 69% increase in medications covered
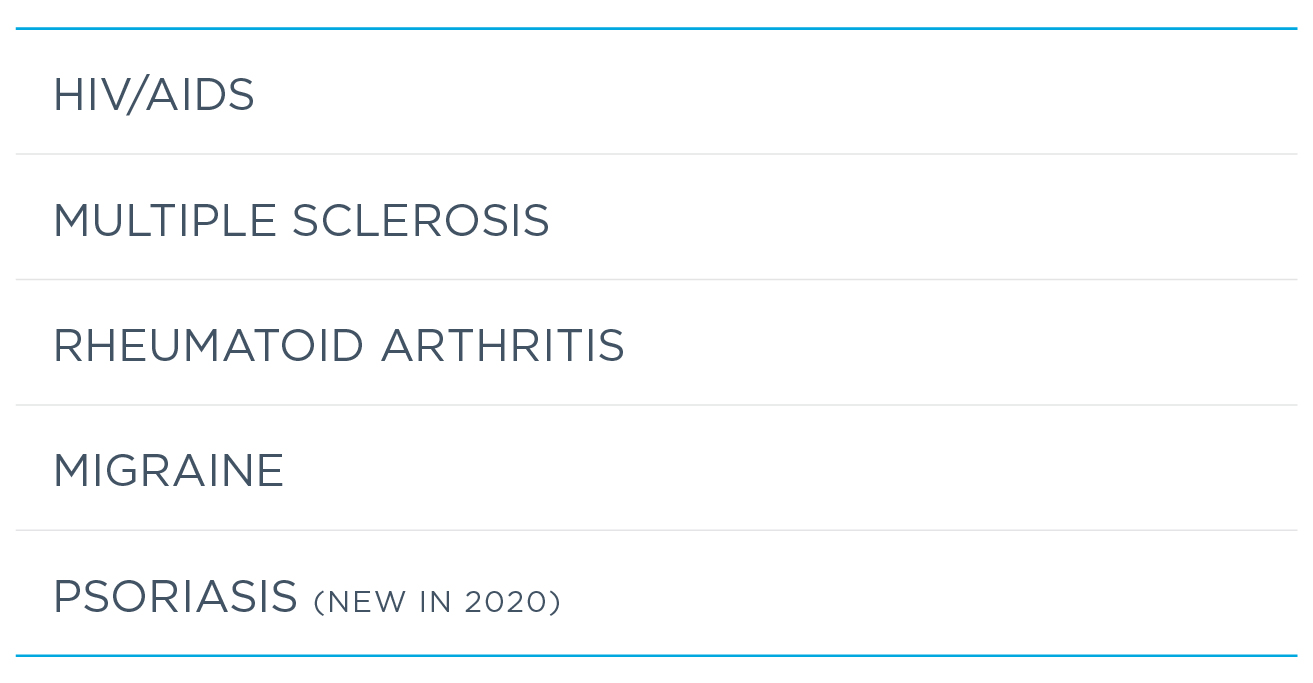
DISEASE STATES COVERED BY SPECIALTY PATIENT ENROLLMENT
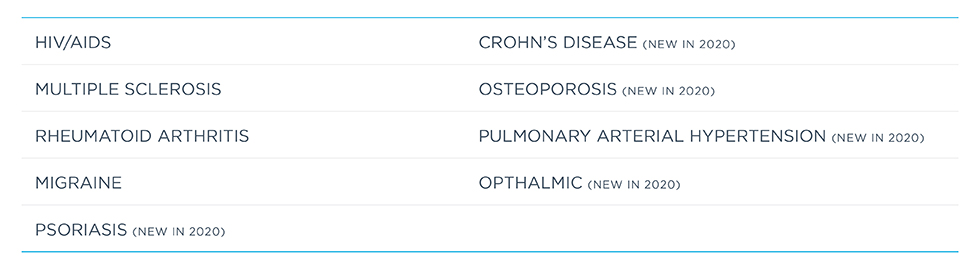

In 2020, Surescripts further streamlined the specialty medication process with two new network services, Specialty Medications Gateway and Electronic Prior Authorization for specialty pharmacies. Specialty pharmacies can now gather clinical information and conduct prior authorizations within their workflow, enabling patients to get on therapy faster and giving specialty pharmacists more time to serve as trusted partners and resources for patients with serious and complex illnesses.
INFORM CARE DECISIONS
EXPANDING INTEROPERABILITY ACROSS HEALTHCARE
MEDICATION HISTORY
Medication History gave clinicians a more complete and accurate electronic picture of medication use for individuals and populations in 2020, making for better-informed care decisions across care settings, including acute and long-term and post-acute care.
We continued to improve quality and accuracy with the adoption of Medication History v3—supported by NCPDP SCRIPT standard v2017071—which deduplicates records for medications with the same NDC, reducing overall transaction volume. Analyzing one month of Medication History data in 2020 found a significant impact:
- 62% of Medication History responses deduplicated
- 29% of medications deduplicated
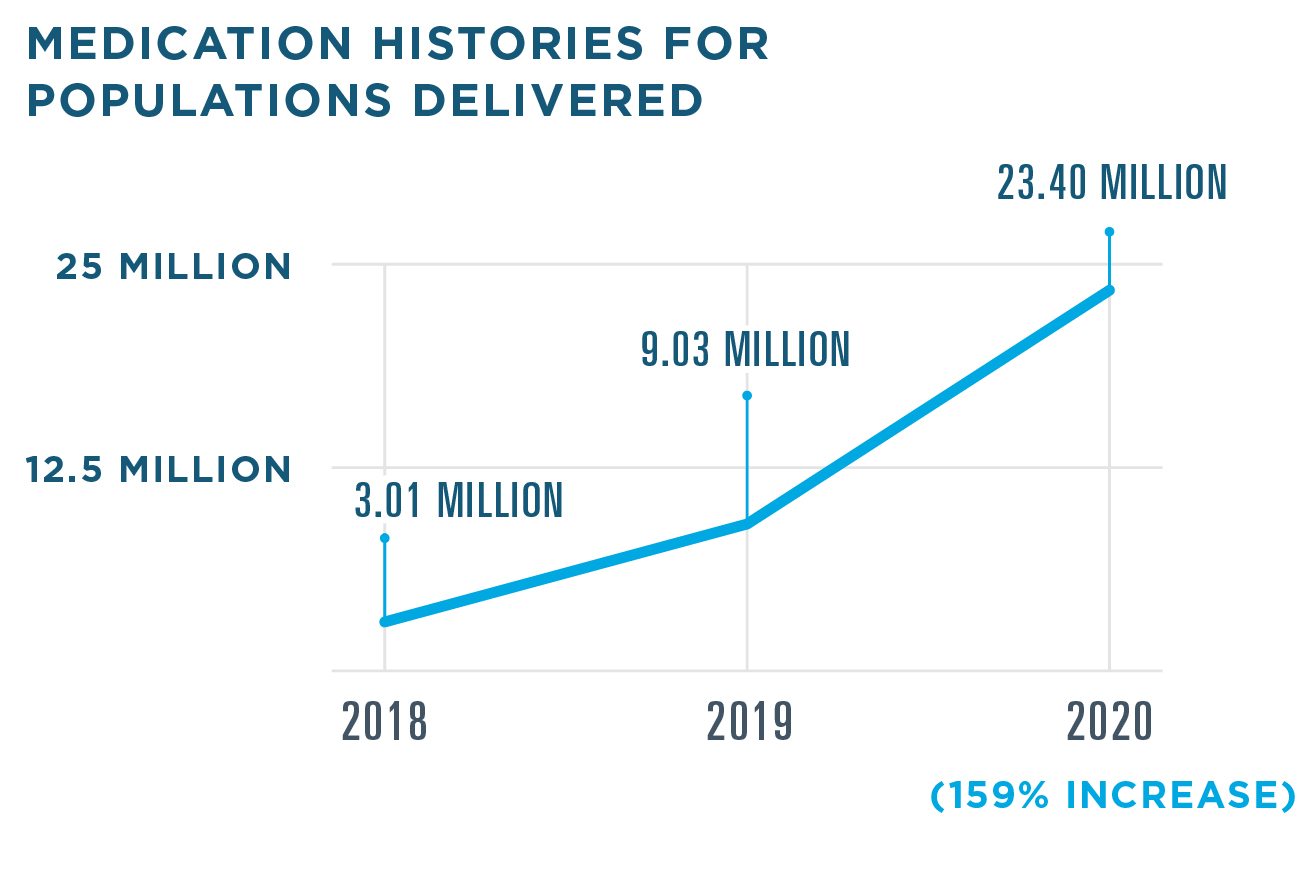
Aledade, a physician-led network of accountable care organizations, sought a way to close care gaps and improve outcomes for patients at risk of medication nonadherence. They developed a pilot program using Surescripts Medication History for Populations to more accurately pinpoint nonadherence for diabetes, cholesterol and hypertension—three-triple weighted measures that account for up to 30% of Aledade’s ratings under the CMS Five-Star Quality Rating System for Medicare Advantage contracts. With this solution in place, they met quality goals while working more efficiently:
- Reduced false positives for medication non-adherence by 26% by eliminating 585 unnecessary patient interventions out of 2,235 opportunities identified from payer claims data
- Achieved ratings of 4, 4, and 5 stars for diabetes, cholesterol and hypertension, resulting in pay-for-performance bonuses17
RECORD LOCATOR & EXCHANGE
Record Locator & Exchange leverages the Carequality framework so healthcare providers can quickly see where patients have received care and locate medical records, regardless of care setting and EHR. In 2020, it was used by more than 137,000 clinicians from 23,414 organizations spanning all 50 states and Washington, D.C.
CLINICAL DIRECT MESSAGING
Clinical Direct Messaging connects the healthcare ecosystem through the exchange of secure, HIPAA-compliant protected health information across multiple clinical scenarios—including COVID-19 case reporting.
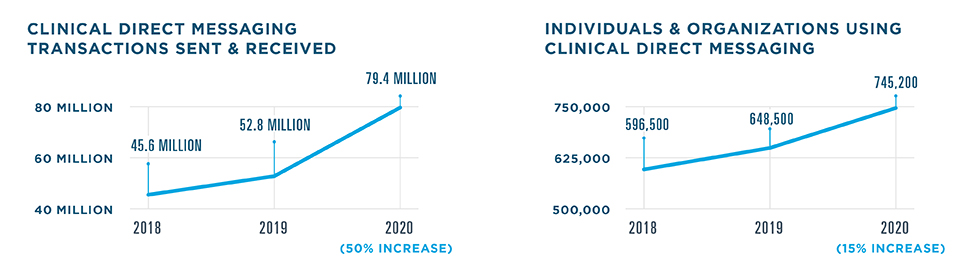
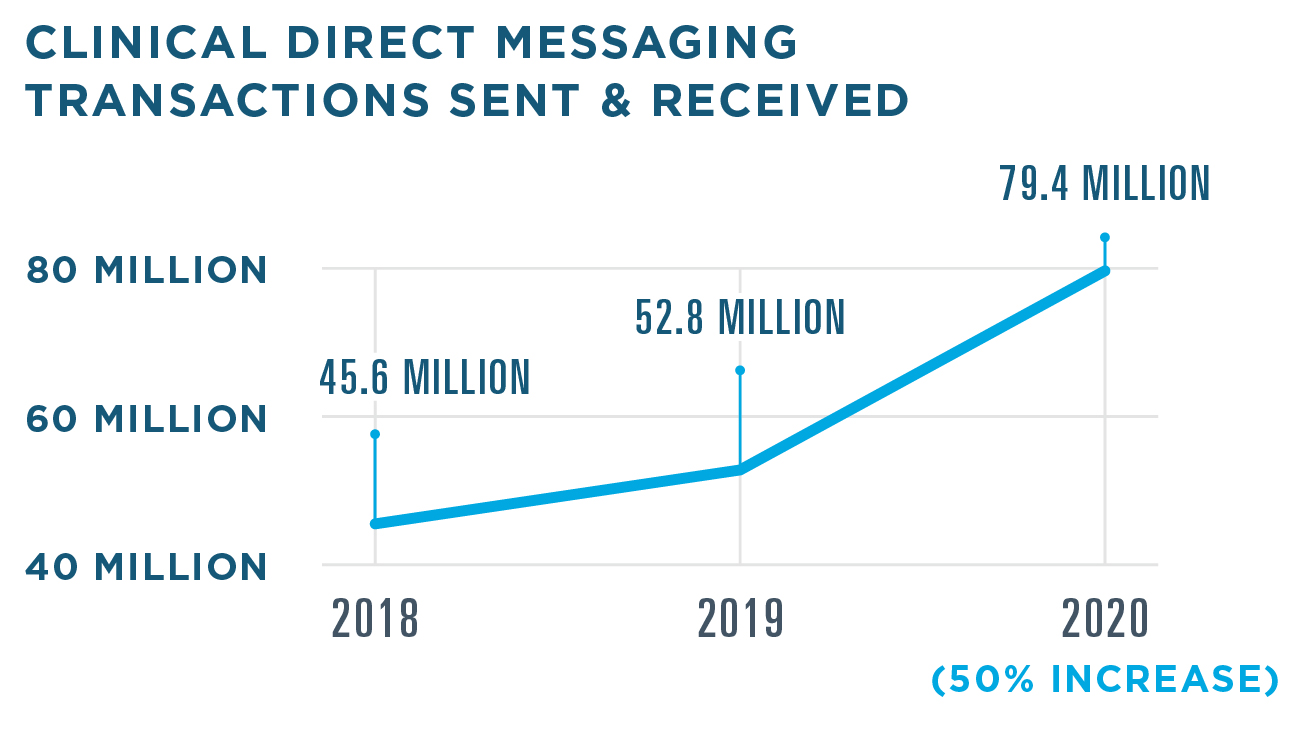
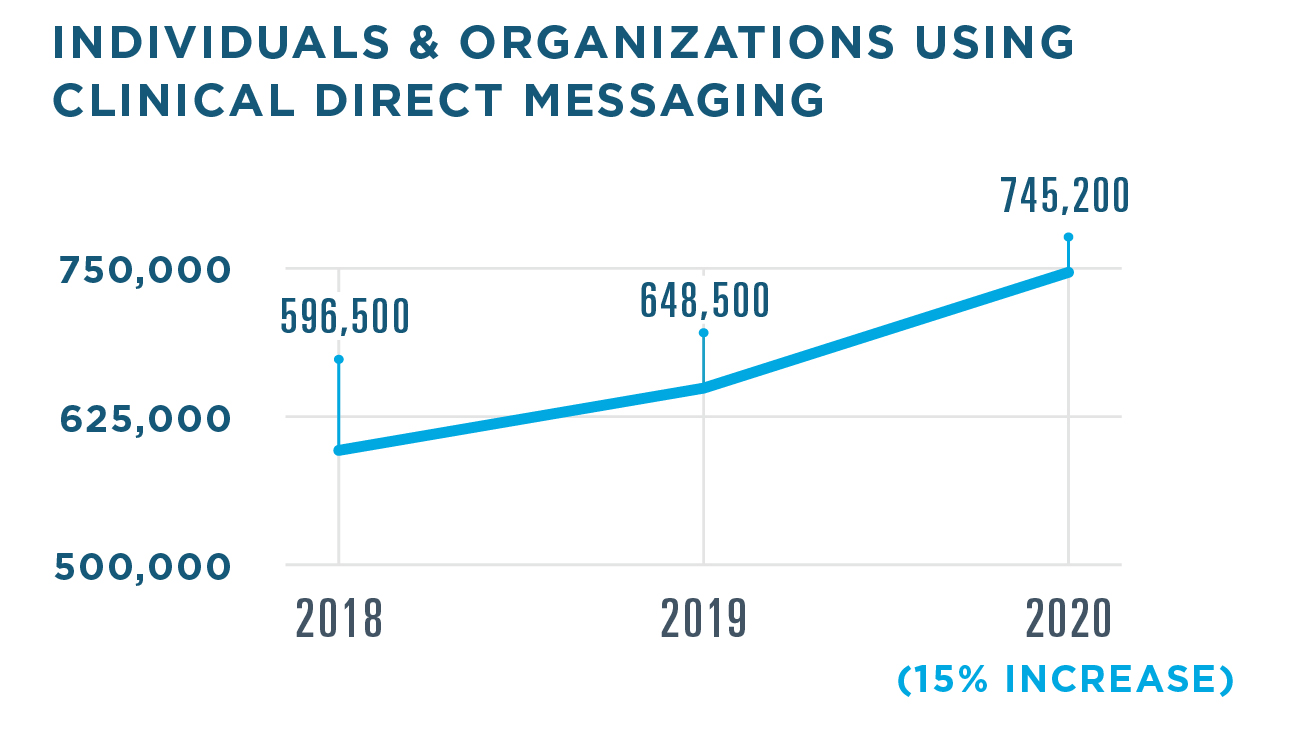
The need for standards-based interoperability tools shone brighter than ever as healthcare organizations and public health agencies strove to share information and coordinate a response to the COVID-19 pandemic. In 2020, Clinical Direct Messaging was used to quickly and securely transmit COVID-19 diagnosis reports to public health agencies for review and action. This solution also proved helpful in managing treatment and vaccinations: pharmacies, PBMs and health plans used Clinical Direct Messaging to alert prescribers about formulary changes and immunizations, including the flu and COVID-19.
- 35 healthcare organizations enabled for electronic case reporting for COVID-19
- 5.97 million COVID-19 case reports sent to 61 jurisdictions nationwide
- 122,688 physician notifications delivered
INSIGHTS FOR MEDICATION ADHERENCE
In 2020, Insights for Medication Adherence, helped more clinicians identify adherence issues and gaps in care with patient-specific medication summaries and real-time messages from PBMs and health plans.