In 2018, healthcare faced tremendous changes on all sides. Throughout it all, the Surescripts Network Alliance™ united partners from all corners of the market to harness innovative technologies and transform health outcomes for the benefit of all. Read on to see what we achieved together:
-
01
- A Letter from Our CEOAs U.S. healthcare raced forward, the Surescripts Network Alliance didn't just keep pace. Data shows we often set it.
-
02
- Network Alliance
In an era of fierce competition, the Surescripts Network Alliance moved forward through collaboration.
-
03
- Enhance Prescribing
As healthcare professionals faced intense pressure to provide better care more efficiently, we eased the burden by enhancing prescribing.
-
04
- Inform Care Decisions
In a landscape of dizzying complexity, we delivered clarity by informing care decisions with actionable patient intelligence.
-
05
- Advance Healthcare with Data
We led peer-reviewed research that highlighted challenges in prescription accuracy and tracked health IT's role in disaster response.
A Letter from Our CEO
Rapid Progress in an Age of Massive Change
It’s said that change is the only constant, and in healthcare, that’s always been true. But in 2018, the
pace
of change in American healthcare felt almost unprecedented.
Drug pricing made headlines, and data confirmed that medications are taking up a greater share of budgets: Prescription drug spending was projected to rise faster than spending in any other major healthcare sector.1
The impact was magnified for the growing share of Americans managing chronic conditions2
and those taking expensive specialty medications, which are expected to surpass half of U.S. drug spending by 2022.3
To help manage rising costs, the market continued its shift toward value-based care. Healthcare providers, clinicians and pharmacists had to wield an increasing volume of complex data as rules tying government reimbursements to total cost
of care kicked into effect,4
underscoring the need for
interoperability
and information exchange between organizations across the country.
Patients, too, sought ways to get the most out of their healthcare dollar, spurred partly by a surge in high-deductible health plans5
and partly by expectations set by an ever more connected and convenient
consumer environment. The industry fielded patients’ demands for more options, more
transparency
and more portability of healthcare information.
Legislators and regulators had an eye on all of these developments, displaying extraordinary levels of activity and involvement. Now more than ever, what happens in healthcare happens on a national stage.
These changes have
complicated decision-making at the point of care and heightened the need for collaboration among pharmacists, physicians, payers and patients. In 2018, the
Surescripts Network Alliance™
rose to the challenge by forging stronger connections, deploying new innovations and exchanging an unprecedented volume of actionable intelligence.
This report examines a year’s
worth of data to track our progress enhancing prescribing, informing care decisions and advancing healthcare across the nation.

NETWORK ALLIANCE
MORE CONNECTIONS, MORE HIGH-QUALITY DATA
In 2018, we expanded and enhanced our reach among organizations that connect pharmacists, physicians, payers and patients. These organizations make up the Surescripts Network Alliance—and make Surescripts the nation’s single most trusted
and capable health information network.
The Surescripts Network Alliance connects virtually all electronic health record (EHR) vendors, pharmacy benefit managers (PBMs), pharmacies and clinicians—plus an increasing number of health
plans, long-term and post-acute care organizations and specialty pharmacy organizations—with:
1.61 Million
healthcare professionals
10%
increase in 2018
258 Million Patients
(8 million unique patients added in 2018) Covering 79% of the U.S. population and 93% of insured patients in our master patient index*
*Calculated using a new methodology that more accurately identifies unique individuals covered by connected PBMs and is adjusted to account for individuals with multiple coverage.
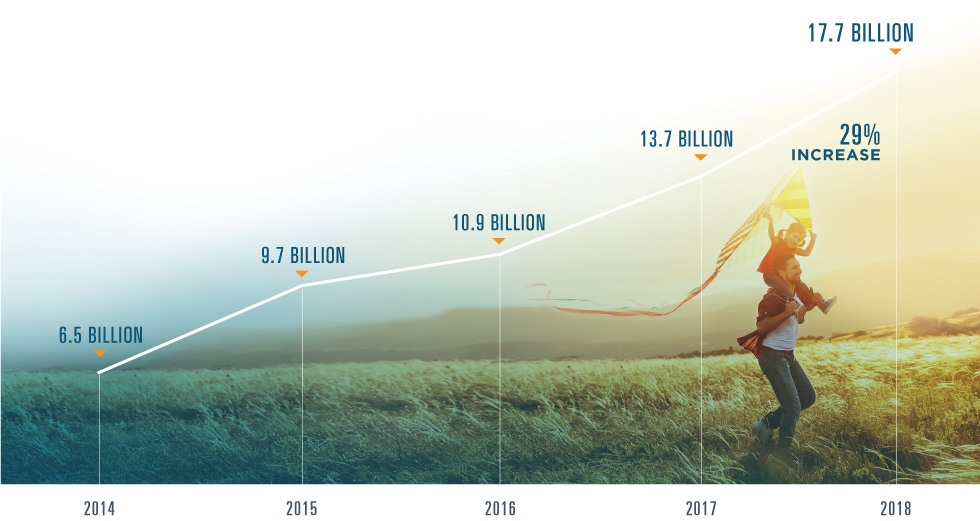
Network Transactions
Surescripts processed 17.7 billion transactions in 2018, a jump of 29% from 2017.
When we look at this vast exchange of actionable patient intelligence across care settings, we see interoperability in action—and in evolution. For some transaction types, achieving massive adoption lets us shift our attention toward the next step: improving the quality of that intelligence. Other transactions are still emerging, but early results suggest an enormous potential impact once they reach widespread use.
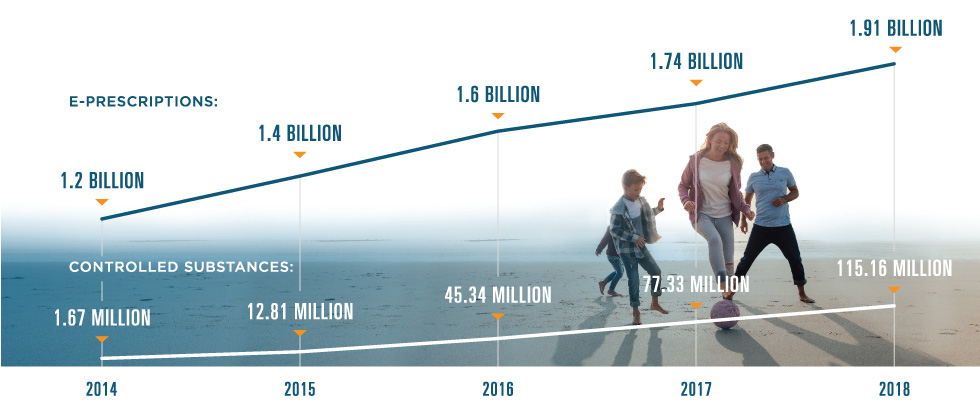
1.91 Billion
e-prescriptions
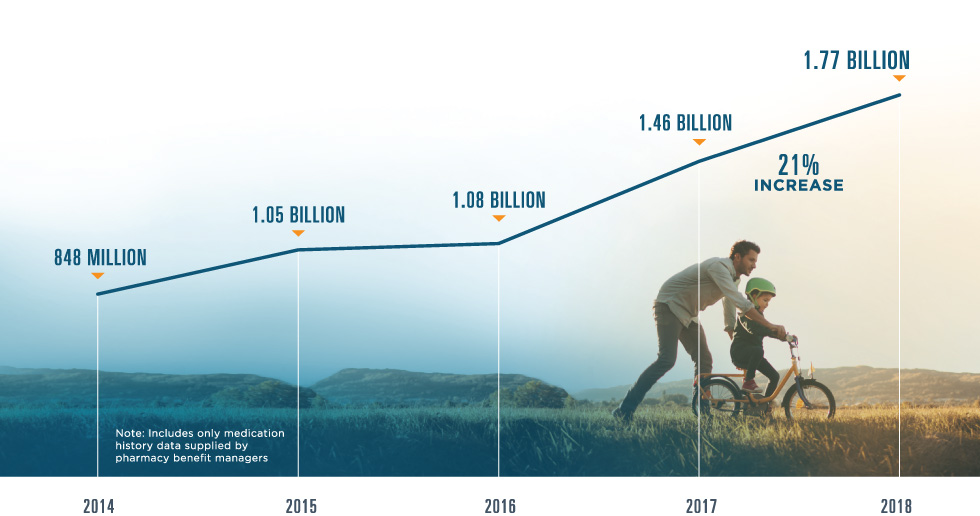
1.77 BILLION
medication histories
108 MILLION
links to clinical document sources
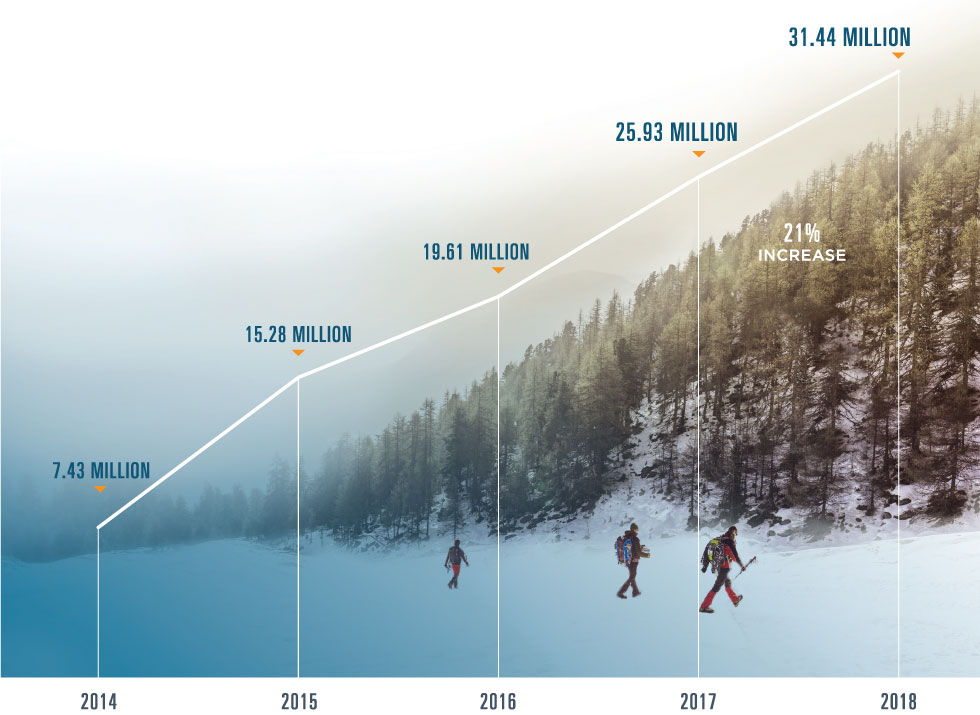
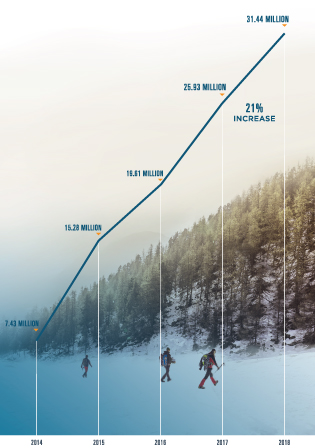
31.44 MILLION
clinical direct messages
Ensuring trust, reliability & data quality
The rapid growth we saw in 2018 was supported by high-availability operations and advances in the realms of security, data quality and standards development.
In 2018, we achieved:
- 99.9% Network Uptime
- Less than one second Average response time for aggregated patient data
- Hitrust CSF certified status for key platforms, placing surescripts in an elite group of organizations worldwide
We also continued to track and celebrate
prescription accuracy, building on our
Critical Performance Improvement program established in 2016 with input and feedback from across the Network Alliance. All prescriptions processed by Surescripts, except those for compounds and supplies, are analyzed by Surescripts Sentinel®,
which identifies opportunities for quality improvement.
Our Quality Index Score (QIS) is used to measure factors that could impact the prescribing process, including prescription accuracy, directory alignment and adoption of appropriate transactions. In 2018, Surescripts improved the accuracy of e-prescription transactions by 14%, meaning physicians and pharmacists spent less time exchanging phone calls and faxes to clarify prescriber intent.
We also recognized
five EHR vendors with the 2018
White Coat Award
for their achievements in prescription accuracy between August 2017 and August
2018:
2018 White Coat Awards
-
TRAILBLAZER AWARD:
-
For top achievements in addressing key issues that impact prescription accuracy (including Drug Description, Drug ID, Sig & Potency Unit Code)
-
-
HIGHEST ACCURACY AWARD:
-
For the highest overall QIS
-
-
MOST IMPROVED ACCURACY AWARD:
-
For the largest improvement in QIS
-
2018 Winners
-
Tier: More than 20,000 users
-
ALLSCRIPTS/VERADIGM
-
Trailblazer Award
-
-
NEXTGEN HEALTHCARE
-
Highest Accuracy Award
-
-
VIRENCE HEALTH TECHNOLOGIES
-
Most Improved Accuracy Award - 505% increase
-
-
Tier: Up to 20,000 Users
-
ISALUS HEALTHCARE
-
Trailblazer Award
-
Highest Accuracy Award
-
-
MEDENT
-
Most Improved Accuracy Award - 182% increase
-
Elevating Industry Standards
In 2018, we convened the Network Alliance to support the industry's transition to the National Council for Prescription Drug Programs SCRIPT Standard v2017071, which has a regulatory effective date of January 1, 2020. The new standard will:
- MODERNIZE E-PRESCRIBING AND MEDICATION HISTORY TRANSACTIONS
- IMPROVE PATIENT SAFETY AND PRESCRIPTION ACCURACY
- MINIMIZE MANUAL PROCESSES THAT REQUIRE CARE PROVIDERS TO STEP OUT OF THEIR WORKFLOWS TO EXCHANGE CRITICAL PATIENT INFORMATION
We worked to build consensus around how to leverage the new standard and guide our partners through the migration process by engaging with thousands of participants during:
- 10 WEBINARS
- 5 CONFERENCE CALLS
- 5 INFORMATION SESSIONS AT INDUSTRY EVENTS
- OFFSITES
- ONE-ON-ONE LEARNING SESSIONS
At the end of 2018, 16 Network Alliance participants had joined our Wave 1 early adopter program and three were certified, including AIS Healthcare, DAW Systems (ScriptSure Cloud) and Kalos, Inc.
ENHANCE PRESCRIBING:
SAFER, MORE AFFORDABLE PRESCRIPTIONS
When a prescriber and patient decide on a medication, they hope for a smooth, straightforward path toward treatment. In 2018, we worked to eliminate many of the barriers that stand in their way.
One barrier is unexpected prior authorization
requirements, which cause treatment delays according to the vast majority of U.S. physicians6
and trigger prescription abandonment nearly 40% of the time.7
Another barrier is sticker shock
at the pharmacy, where 10% of abandoned prescriptions are left behind due to cost.8
Then there are risks that come with relying on paper prescriptions for controlled substances, leaving room for fraud and diversion.
But we're making progress. In 2018, we
enhanced prescribing
to reduce the delays, unexpected costs and administrative work that waste valuable time and interfere with safe, effective treatment.
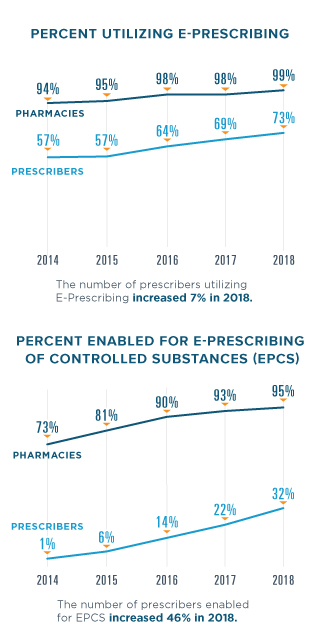
E-PRESCRIBING
In 2018, Surescripts processed 5.24 million electronic prescriptions per day.
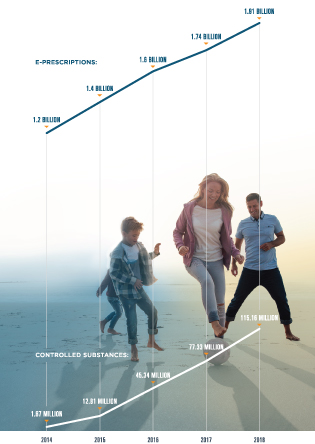
PERCENT OF PRESCRIPTIONS SENT ELECTRONICALLY
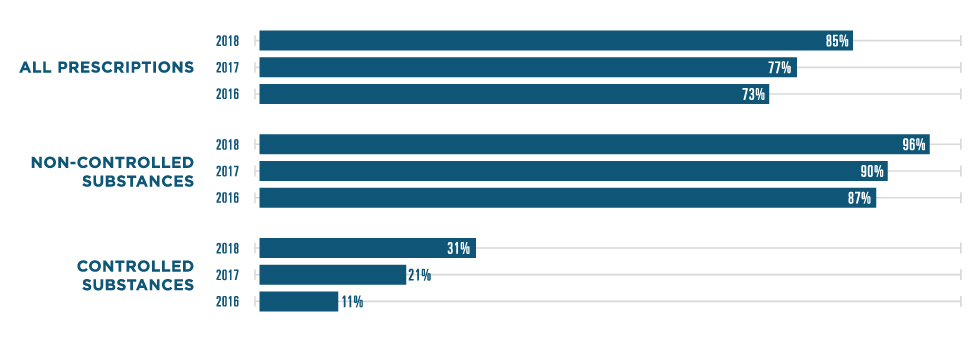
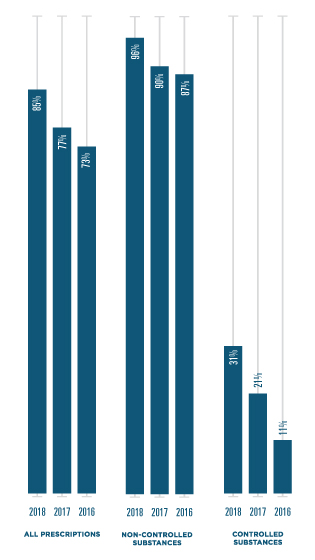
*Note: Percentages calculated using prescription data from the National Association of Chain Drug Stores. Surescripts estimates that 84% of e-prescriptions are dispensed.9
SPOTLIGHT: CANCELRX
When a prescriber needs to cancel a prescription, time is of the essence. In 2018, the Surescripts Network Alliance vastly increased its use of the CancelRx transaction to resolve prescription accuracy and safety issues within the prescribing workflow before they could impact patients.
TRANSACTIONS
2017
3.8 MILLION
2018
11.8 MILLION (+210%)
CERTIFIED PRESCRIBERS
2017
555,000
2018
680,000 (+23%)
CERTIFIED PHARMACIES
2017
31,000
2018
46,000 (+48%)
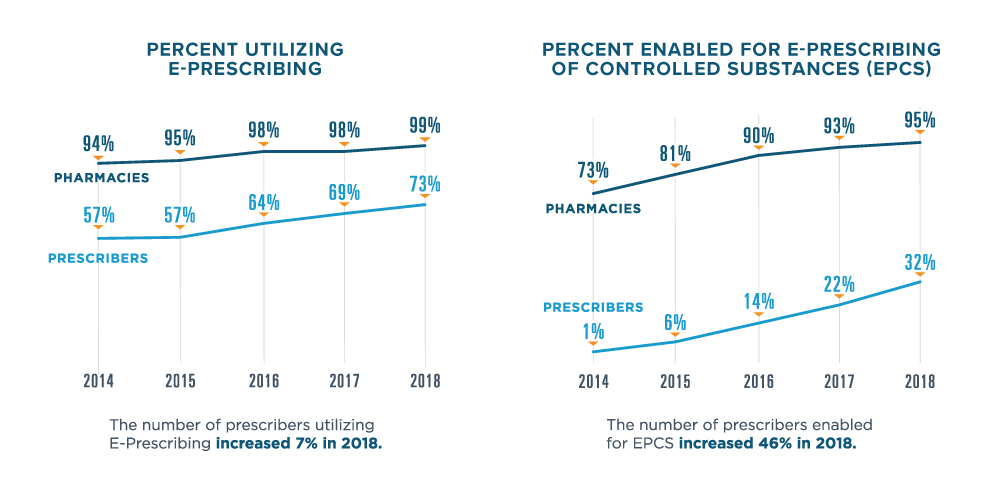
ACTIVE PRESCRIBERS
+122% IN 2018
ACTIVE PHARMACIES
+86% IN 2018
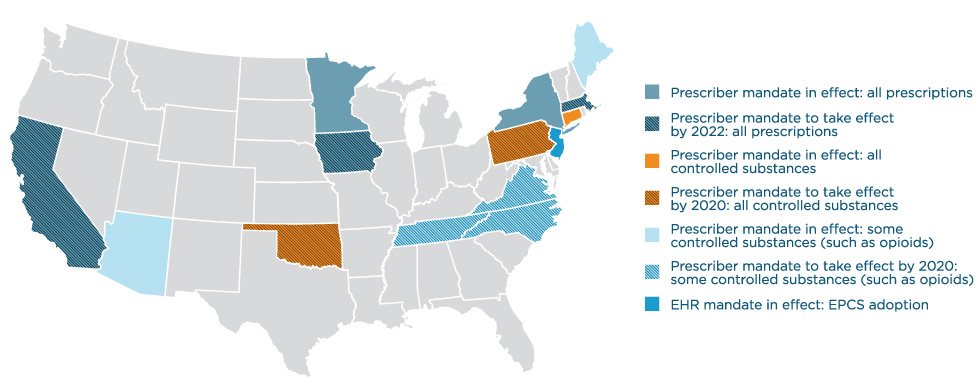
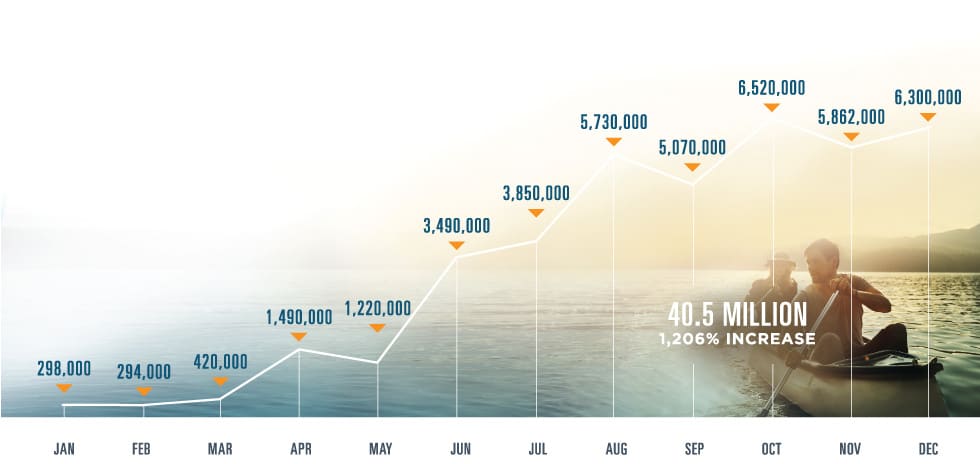
EPCS ACROSS THE NATION
In 2018, state and federal legislators continued to recognize
EPCS
as an essential tool in combatting the opioid epidemic. Congress passed and President Trump signed into law H.R. 6, the Substance Use-Disorder Prevention That Promotes Opioid Recovery and Treatment (SUPPORT) for Patients and Communities Act, which
requires that controlled substance prescriptions covered under Medicare Part D be transmitted electronically as of January 1, 2021.
Eight states passed their own mandates in 2018, bringing the total number of states with legislation requiring
e-prescribing for opioids, controlled substances or all prescriptions to 15. Mandates in Minnesota, New York, Maine and Connecticut had taken effect by January 2018, with the majority of the others set to take effect in 2020.
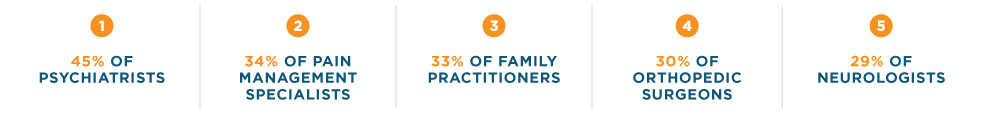
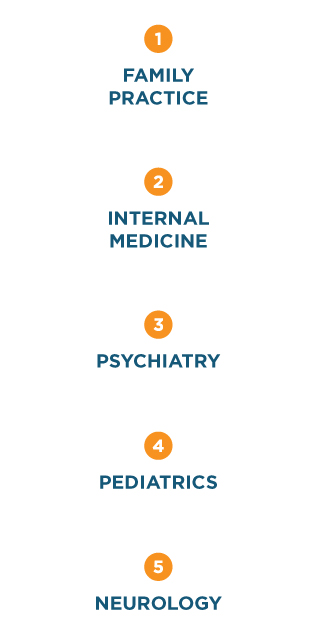
TOP 5 SPECIALTIES USING EPCS
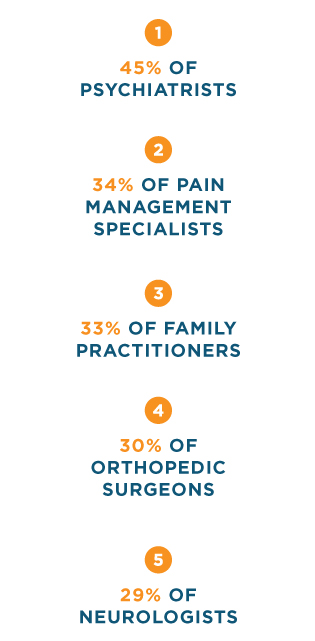
SPOTLIGHT: OPIOIDS
As overall opioid prescribing rates continued to decline across the U.S.,10
electronic prescriptions for opioids increased by nearly half in 2018—a big step forward for safety, with more prescribers utilizing this critical
tool for opioid prescriptions. A nearly 90% increase in e-prescriptions of buprenorphine shows that clinicians also relied on e-prescribing to help treat opioid dependence and addiction.
In 2018, five opioids accounted for more than 87% of all opioid e-prescriptions:
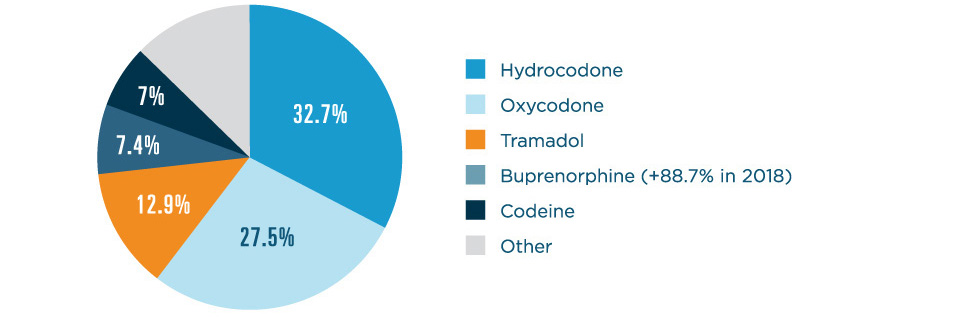
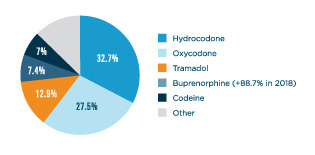
*Note: Percentage calculations include all new electronic prescriptions and approved renewals for opioids.
EPCS STATE RANKINGS
| 2018 Rank | 2017 Rank | State | Pharmacy Enablement | Prescriber Enablement | Controlled Substances Prescribed Electronically* |
|---|
*Calculations only include filled prescriptions, based on a 16.16% return-to-stock rate.11
HIGHLIGHTS
State legislation mandating the use of electronic prescribing is having a measurable impact on provider enablement.
New York: New York continued to lead the nation for the fourth year in a row thanks to its iSTOP law mandating e-prescribing for all prescriptions, which took effect in March 2016. In 2018, progress continued with 77.3% of prescribers enabled for EPCS and 98.2% of pharmacies enabled for EPCS.
Connecticut: Connecticut’s mandate took effect in January 2018, prompting an impressive jump of 8 places above its 2017 ranking. Now 59.6% of prescribers and 98.9% of pharmacies are enabled for EPCS in Connecticut.
Arizona: Ahead of an e-prescribing mandate for opioids that took effect in January 2019 (and was subsequently delayed until January 2020), Arizona jumped from 22nd to 11th place in 2018—the largest rise in the country. At the end of the year, 47.2% of its prescribers and 98.6% of its pharmacies were enabled for EPCS.
Vermont: In 2018, Vermont ascended from 19th place to 10th. While Vermont doesn’t have an EPCS mandate of its own, its proximity to three states that do (Connecticut, Maine and New York) and one state that will in 2020 (Massachusetts) may have served as a catalyst for its rise.
ELIGIBILITY & FORMULARY
The foundation for solutions including Real-Time Prescription Benefit and Electronic Prior Authorization, Eligibility & Formulary gives providers the ability to check a patient’s benefits. In 2018, it informed nearly every physician office visit and hospital outpatient visit in the nation.12
2.7 BILLION
Eligibility & Formulary responses
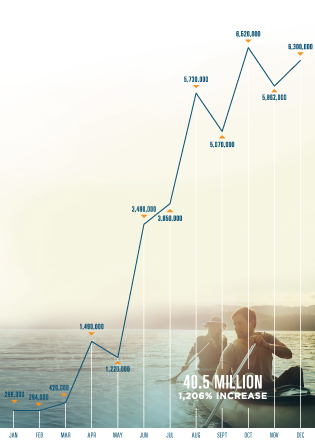
REAL-TIME PRESCRIPTION BENEFIT
In 2018, the momentum behind
prescription price transparency
was stronger than ever,
led by high demand from the nation’s prescribers. When we commissioned a survey of more than 500 U.S. healthcare professionals, 78% said they considered patients’ out-of-pocket costs very important and 69% considered information on lower-cost
alternatives very important.13
Surescripts met that need with
Real-Time Prescription Benefit,
which displays patient-specific, formulary-based out-of-pocket cost information for the prescriber’s choice of drug and the patient’s choice of pharmacy—along with up to five therapeutic alternatives—in real time within the EHR
workflow.
1,338% INCREASE
in provider adoption
76% OF U.S. PATIENTS
covered by data supplied directly by PBMs
80% OF U.S. PRESCRIBERS
served by contracted EHRs (up from 58% in 2017)
REAL-TIME PRESCRIPTION BENEFIT CHECKS
IMPACT OF REAL-TIME PRESCRIPTION BENEFIT
Data we collected throughout 2018 highlighted the enormous time and cost savings possible with Real-Time Prescription Benefit:
28% change rate to avoid prior authorization: When prescribing a medication requiring a prior authorization and presented an alternative without a prior authorization, prescribers using Real-Time Prescription Benefit switched the drug 28% of the time.
>158,000 hours of potential wait time eliminated per month: Based on average prior authorization wait times,14 avoiding prior authorizations via Real-Time Prescription Benefit helped health systems collectively improve time to treatment by hundreds of thousands of hours.
Up to $8,032 in patient savings per prescription: One patient in 2018 saved as much as $8,032 in out-of-pocket costs on a single prescription fill thanks to Real-Time Prescription Benefit.
AVERAGE SAVINGS PER PRESCRIPTION WHEN A LOWER-COST ALTERNATIVE IS CHOSEN
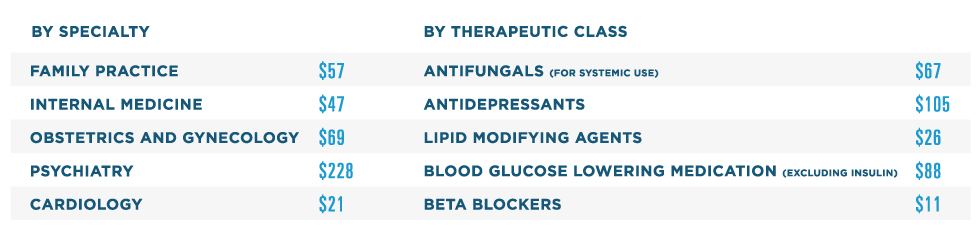
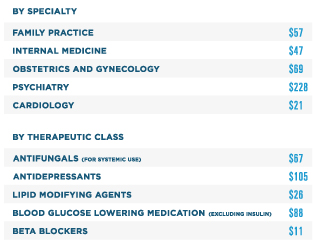
Note: Listed in order of volume. Classification based on pharmacologic class.
ELECTRONIC PRIOR AUTHORIZATION
In addition to displaying cost information, Real-Time Prescription Benefit flags medications that require prior authorization. If a prescriber doesn’t choose an alternative medication, and they have access to Electronic Prior Authorization, they can move seamlessly into an integrated and dramatically faster prior authorization process.
128% INCREASE
in provider adoption
172% INCREASE
in transactions in all 50 states and D.C., plus Puerto Rico, Guam and overseas military installations
89% OF U.S. PATIENTS
covered by data supplied directly from PBMs and health plans
77% OF U.S. PRESCRIBERS
served by contracted EHRs
TOP 5 SPECIALTIES USING ELECTRONIC PRIOR AUTHORIZATION

INFORM CARE DECISIONS:
EASIER ACCESS TO CRITICAL PATIENT INSIGHTS
Lack of timely insight into the other care and medications patients are (or aren’t) receiving is both dangerous and costly. For instance, patients whose outpatient care teams do not receive a timely hospital discharge summary are 10 times likelier
to return to the hospital.15
Beyond the health risks of failing to take medication as prescribed, non-adherence has been estimated to produce up to $300 billion in avoidable costs per year in the U.S.16
The Surescripts Network Alliance is addressing these issues by delivering patient insights to critical points in care, backed by a long history of collaboration around
interoperability. We continue to engage with the industry as founding members of DirectTrust and Carequality, whose governance framework for interoperability has been implemented nationwide.
In 2018, we
informed care decisions
to help clinicians see beyond the exam room, connecting them to patient medication history, clinical records and other
care providers across the country.
MEDICATION HISTORY
In 2018, Surescripts Medication History solutions continued to give care teams a more complete and accurate picture of their patients’ medications. Medication History for Reconciliation in particular was enriched by the addition of several significant new PBM and pharmacy data sources, making the reconciliation process even more efficient.
MEDICATION HISTORIES DELIVERED

90% OF U.S. PATIENTS
represented (up from 82% in 2017)
90% OF EHRs
connected
1.9 million
medication histories for populations delivered to health systems, hospitals and accountable care organizations to help manage cost-effective care (+436% in 2018)
RECORD LOCATOR & EXCHANGE
Record Locator & Exchange helped bring interoperability to life for thousands of healthcare organizations in 2018, giving clinicians access to nationwide health information exchange through a single connection at the point of care.
99 MILLION
care location summaries exchanged (+52% in 2018)
>106,000 CLINICIANS
using Record Locator & Exchange (+105% in 2018), representing 4,680 active healthcare organizations (+50% in 2018) across all 50 states and D.C.
107 MILLION
links to clinical document sources (+586% in 2018)
Record Locator & Exchange benefited clinicians in a number of areas in 2018. Here are some of the stories we heard from our users.
Primary Care: After a primary care physician used Record Locator & Exchange to access a patient's previous CT scan results, she increased the urgency of treatment and referred her patient to a lung cancer specialist.
Quality of Care: A primary care provider used Record Locator & Exchange to identify specialists who had provided care to patients with chronic diseases and ensure they received recommended screening tests, such as retinal exams for diabetes patients.
Emergency Care: A triaging ER physician used Record Locator & Exchange to learn of his patient’s serious cardiovascular disease and ordered immediate transfer to the university hospital for aggressive treatment.
Care Coordination: When a transplant coordination team used Record Locator & Exchange to review records for a new patient with lupus, they learned she had previously been diagnosed with a blood clot in her heart and added blood-thinning medication to her treatment plan.
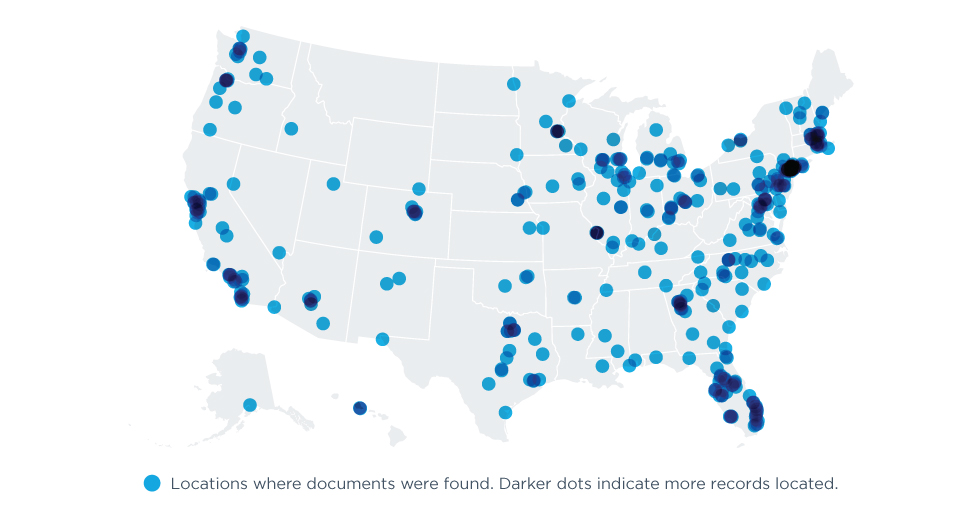
CASE STUDY: YALE NEW HAVEN HEALTH
In 2018, Yale New Haven Health used Record Locator & Exchange to locate clinical documents for their patients from well beyond their home base in Connecticut, including 49 states, D.C. and Puerto Rico.
CLINICAL DIRECT MESSAGING
Built using the Direct protocol, Clinical Direct Messaging connects clinicians, pharmacists and other healthcare professionals with secure, HIPAA-compliant exchange of protected health information. In 2018, hundreds of thousands of users relied on Clinical Direct Messaging to improve transitions of care, send immunization notifications, coordinate medication management efforts and achieve government incentives requiring the use of secure electronic messaging from within the EHR.
596,000 USERS
(+13% in 2018) across all 50 states and D.C., including nearly 24,000 pharmacies
CLINICAL DIRECT MESSAGES TRANSMITTED
ADVANCE HEALTHCARE WITH
ACTIONABLE INTELLIGENCE
Every year, our National Progress Report helps quantify the impact we've made on U.S. healthcare and illuminates opportunities for further growth. The wealth of actionable intelligence available across the Surescripts Network Alliance also uniquely equips us to advance healthcare through peer-reviewed research. In 2018, we concentrated our research efforts on two areas in particular:
DISASTER RESPONSE
Published in Health Affairs, "Access to E-Prescriptions and Related Technologies Before and After Hurricanes Harvey, Irma, and Maria" examined E-Prescribing and Medication History transactions in areas affected by recent major hurricanes to assess how health IT infrastructure is used during natural disasters and how quickly it bounces back after a disruption.
Surescripts researchers concluded that when disaster strikes, "access to e-prescribing and medication histories via EHRs could allow for the quicker recovery of essential medical services—but only with robust infrastructure in place to mitigate the impact of catastrophes and essential emergency preparedness policies and collaborative agreements between critical stakeholders."17
PATIENT SAFETY
What happens when prescribers decide to stop or change a patient's medication? Sometimes, they try to convey the message within a new e-prescription transaction, which has the potential to cause confusion and even harm.
To find out how often that
occurs, Surescripts researchers partnered with informaticists from Yale New Haven Health, Connecticut Children's Medical Center and the University of Connecticut to analyze 1.4 million NewRx transactions in a paper published in the Journal of the American
Medical Informatics Association. "While the incidence of prescribers using the NewRx to transmit cancellation instructions was low," they wrote, "their transmission in NewRx fields not intended to accommodate such information can produce significant potential
patient safety concerns, such as duplicate or inaccurate therapies." The study found that expanding use of the CancelRx transaction—designed to let prescribers clearly and promptly cancel a prescription—could prevent nearly 10 million potential
patient safety risks per year.18
Backed by data and united with the Surescripts Network Alliance, we look forward to the discoveries and advances we'll make together in the year ahead.
In 2019, we will continue to expand the actionable patient intelligence we deliver, helping transform care interactions to continually improve the patient experience, drive better outcomes and reduce costs.
— Tom Skelton, Chief Executive Officer
- Centers for Medicare & Medicaid Services, “CMS Office of the Actuary Releases 2017–2026 Projections of National Health Expenditures,” CMS.gov, February 14, 2018.
- Health Care Cost Institute, "2017 Health Care Cost and Utilization Report," February 2019.
- IQVIA Institute for Human Data Science, "2018 and Beyond: Outlook and Turning Points," March 2018.
- "Quality Payment Program: MIPS Overview,"Centers for Medicare & Medicaid Services," accessed February 22, 2019.
- Allison Inserro, "Enrollment in High-Deductible Health Plans Continues to Grow," AJMC Managed Markets Network, August 9, 2018.
- American Medical Association, “2017 AMA Prior Authorization Physician Survey,” 2018.
- Gulzar Virk and Tony Schueth, "Electronic Prior Authorization: Leveraging the Latest Technologies to Improve Care Delivery and Determine Optimal Benefit Coverage," 2015.
- Truven Analytics and NPR, "Health Poll: Prescription Drugs," June 2017.
- Unpublished communication from the National Association of Chain Drug Stores, 2017.
- Centers for Disease Control and Prevention, "2018 Annual Surveillance Report of Drug-Related Risks and Outcomes: United States," August 31, 2018.
- Unpublished communication from the National Association of Chain Drug Stores, 2017.
- “Ambulatory Care Use and Physician Office Visits,” Centers for Disease Control and Prevention, May 3, 2017.
- Surescripts, “2018 Impact Report: Prescription Price Transparency,” February 2019.
- American Medical Association, “2017 AMA Prior Authorization Physician Survey."
- Anja Braet et al., "The Quality of Transitions from Hospital to Home: A Hospital-based Cohort Study of Patient Groups with High and Low Readmission Rates," International Journal of Care Coordination 19, no. 1–2 (June 24, 2016): 29–41.
- Aurel O. Iuga and Maura J. McGuire, "Adherence and Health Care costs," Risk Management and Healthcare Policy 7 (February 20, 2014): 35–44.
- Jaime Y. Smith and Max M. Sow, “Access to E-Prescriptions and Related Technologies Before and After Hurricanes Harvey, Irma, and Maria,” Health Affairs 38, no. 2 (February 2019).
- Yuze Yang et al., “Analysis of Medication Therapy Discontinuation Orders in New Electronic Prescriptions and Opportunities for Implementing CancelRx,” Journal of the American Medical Informatics Association 25, no. 11 (November 2018): 1516–1523.