
Are we ready for the changes reshaping today's healthcare landscape? Thanks to our role delivering actionable patient intelligence to the point of care, that's a question Surescripts can help answer. See how the Surescripts Network Alliance™ enhanced prescribing, informed care decisions and advanced healthcare in 2019.
-
01
- A Letter from Our CEO
Transforming healthcare interactions and outcomes in a shifting market
-
02
- Network Alliance
Expanding information sharing and moving toward greater accuracy and new standards
-
03
- Enhance Prescribing
Collectively enabling safer and more affordable prescriptions
-
04
- Inform Care Decisions
Arming healthcare professionals with actionable patient intelligence
-
05
- Advance Healthcare
Convening, informing and advocating for the healthcare industry
A Letter from Our CEO
Ready for a
Fast-Moving
Future
We are in an unprecedented moment in history. The COVID-19 pandemic has rearranged lives and shifted priorities across the globe, and healthcare is at the center of the whirlwind.
But American healthcare is used to rapid change. Throughout 2019, market forces, government activity, and the expectations of new generations of patients and clinicians were already speeding us toward a world in which our industry must
evolve quickly to succeed.
It’s a world that’s pushing us to share information more efficiently, securely and transparently.
As part of the 21st Century Cures Act, the federal government drafted new rules on information blocking and
interoperability. The latest data from the Office of the National Coordinator for Health Information Technology shows just 46% of U.S. hospitals
and 10% of office-based physicians are able to electronically find, send, receive and integrate patient health information from outside sources.1, 2
Clearly, there is more work to be done as provider organizations and technology vendors
focus on meeting these new regulatory requirements throughout 2020.
With drug pricing a hot topic across the nation, the federal government also issued a rule requiring that Medicare Part D plans adopt real-time prescription benefit tools by 2021. Patients and prescribers too are demanding
prescription price transparency: 4 in 10 providers say prescribing would be more efficient with more information at their fingertips, particularly cost and coverage data.3
Meanwhile, 61% of patients say they’d
be willing to spend extra time, effort or money in order to have informed prescription cost conversations with their doctor—one signal that consumerism is finally taking hold in U.S. healthcare.4
It’s also a world where healthcare costs, data and outcomes are more intertwined than ever.
One insurer predicts that 59% of healthcare payments will be value-based by 2021.5
But as of 2017, 24% of healthcare
executives said they lacked the external interoperability needed for value-based care.6
Controlling costs is further complicated by the rise of specialty drugs, which now account for nearly half of prescription drug spending.7
And cost is not the only barrier for the patients who need them. For many critical
specialty medications, treatment can be delayed by days or weeks due to factors such as prior authorization.
As you navigate our 2019 National Progress Report, you might ask: Are we ready to navigate these changes and see our way through to better, safer, less costly care?
What I see indicates that we are making true progress on each of these fronts. Through a robust and trusted network, continual innovation and the deep engagement of partners across the Surescripts Network Alliance™, we are delivering
actionable intelligence to transform more healthcare interactions and patient outcomes than ever before.
Thank you for joining us as we explore how we enhanced prescribing, informed care decisions and advanced healthcare together in 2019.
NETWORK ALLIANCE
Connecting Healthcare with Speed and Precision
Today, the Surescripts Network Alliance links virtually all electronic health records (EHR) vendors, pharmacy benefit managers (PBMs), pharmacies and clinicians—plus health plans, long-term and post-acute care organizations, specialty hubs and specialty pharmacy organizations—with health data for the vast majority of U.S. patients and virtually all prescribers.
- 1.78 million healthcare professionals and organizations connected (+11% in 2019)
- 0.04 seconds, on average, to retrieve an accurate patient match
- 314 million patients in our master patient index, representing 95%* of the U.S. population
*This includes patient data provided by both pharmacies and PBMs. In previous years, we only included patient data provided by PBMs. The data has been adjusted to account for duplication and patients with multiple coverage.
Maintaining a Trusted, Reliable Network
As the healthcare landscape shifted in 2019, Surescripts Network Alliance participants could count on the strength, security and availability of our network.
- 99.999% approximate uptime
- HITRUST CSF Certified status maintained for key platforms, demonstrating strong privacy, security and risk-management practices and placing Surescripts in an elite group of organizations worldwide
- 10% increase in Quality Index Score for electronic prescriptions across the network (an 80% improvement since 2016)
Surescripts' Quality Index Score measures the effective use of 11 key elements of electronic prescriptions, such as Drug Description, Days Supply, and Potency Unit Code.
Nearing 20 Billion Network Transactions
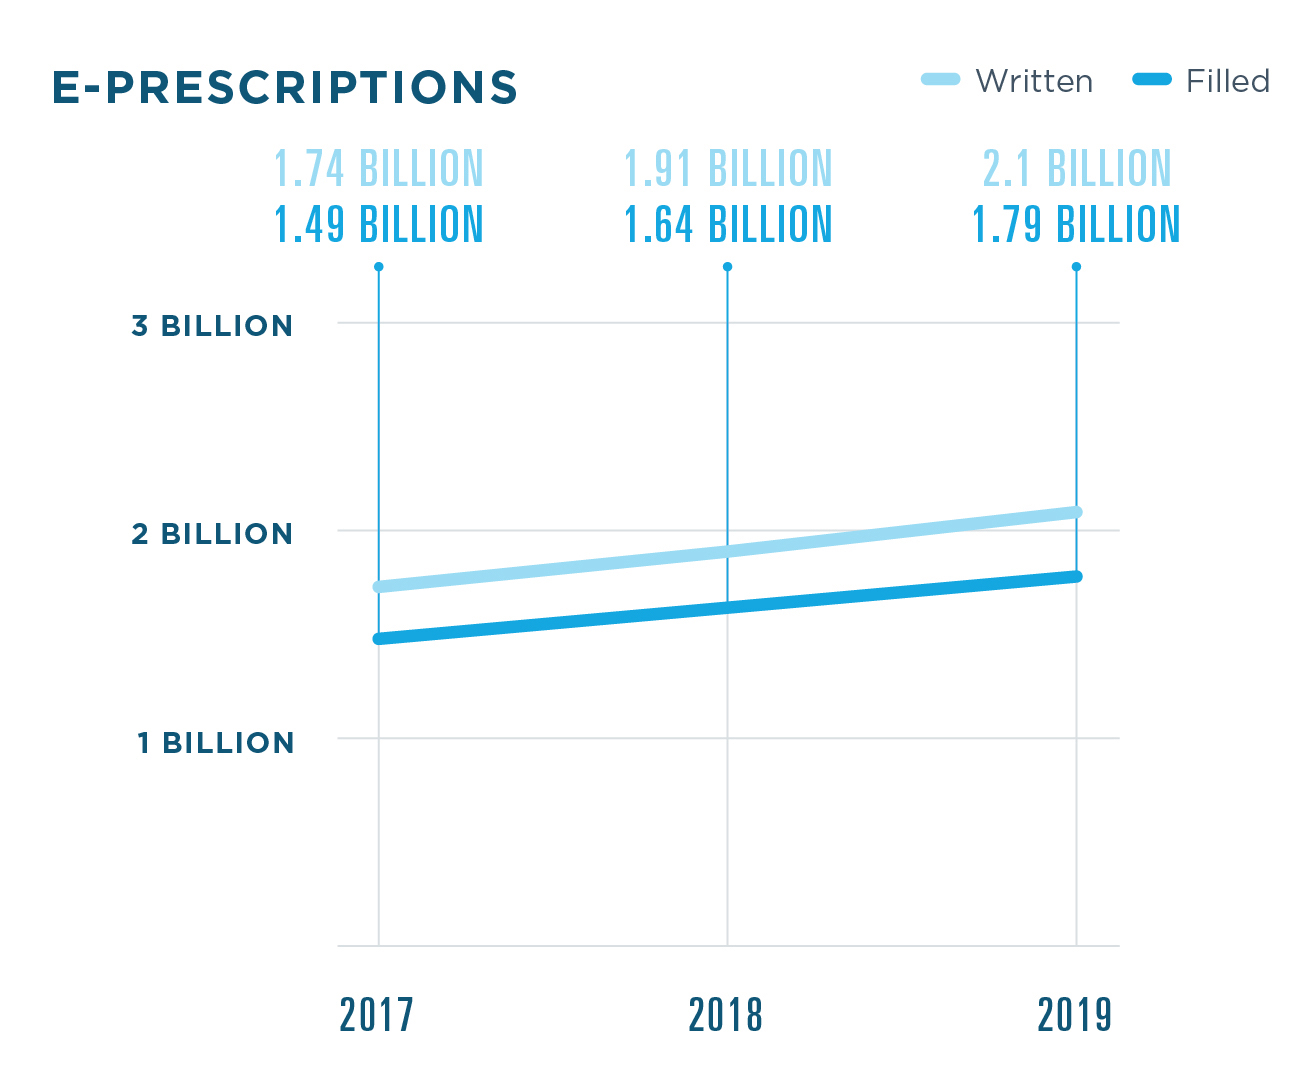
Surescripts processed 19.15 billion transactions in 2019, an 8% increase from 2018..jpg)
- 1.79 billion e-prescriptions filled
- 2.18 billion medication history responses delivered
- 333.8 million links to clinical document sources shared
Historically, Surescripts has reported on the number of prescriptions written electronically nationwide. Going forward, we will be reporting the number of e-prescriptions filled to more accurately reflect the state of industry progress. Surescripts estimates that 84% of e-prescriptions are dispensed.
SPOTLIGHT: ELIGIBILITY & FORMULARY
By giving providers the ability to check a patient’s insurance and prescription benefit coverage, Eligibility & Formulary serves as the foundation for many Surescripts solutions, including E-Prescribing, Real-Time Prescription Benefit, Electronic Prior Authorization, Medication History and Record Locator & Exchange.
- 3 billion eligibility responses (+14% in 2019)
An earlier version of the 2019 National Progress Report inadvertently listed eligibility response volume as 2.8 billion (+4% in 2019).
Tracking & Celebrating Prescription Accuracy
Since 2016, our Critical Performance Improvement program has convened the Surescripts Network Alliance to improve the accuracy of e-prescriptions. Surescripts Sentinel® analyzes electronic prescriptions and identifies opportunities for improvement.
In 2019, we recognized 12 health systems, EHRs and pharmacy industry leaders with the Surescripts White Coat Award for their work optimizing e-prescribing.
EHRS
athenahealth, Inc.
MDLiveCare Inc.
MEDENT
PHARMACY INDUSTRY LEADERS
CVS Health
Humana Pharmacy
KeyCentrix Inc.
Walmart Inc.
HEALTH SYSTEMS
Greater Baltimore Medical Center
MidMichigan Health
Montage Health
Northeast Georgia Health System
University of California San Francisco Health
Guiding the Industry to a New Standard
Throughout 2019, we guided the industry’s migration to the National Council for Prescription Drug Programs SCRIPT Standard Version 2017071, required by the Centers for Medicare and Medicaid Services as of January 1, 2020. Through hundreds of improvements to e-prescribing transactions, the new standard will:
- Reduce manual processes that disrupt provider and pharmacy workflows
- Let pharmacies electronically request prescriptions for medications they have not previously dispensed and readily transfer prescriptions to other pharmacies
- Enrich medication history with additional data elements
- Serve long-term and post-acute care settings with transactions that lend long-awaited clarity, automation and efficiency to this unique market
The majority of Surescripts Network Alliance participants that use E-Prescribing and Medication History had certified to the new standard by the end of 2019, ahead of the Surescripts sunset date for SCRIPT v10.6. They included organizations responsible for:
- 43.5% of e-prescriptions sent from EHRs
- 89.4% of e-prescriptions sent by health systems
- 99.9% of e-prescriptions processed by mail-order pharmacies
- 92.2% of e-prescriptions processed by retail pharmacies
ENHANCE PRESCRIBING
DELIVERING THE RIGHT MEDICATION WITHOUT DELAY
E-PRESCRIBING
.jpg)
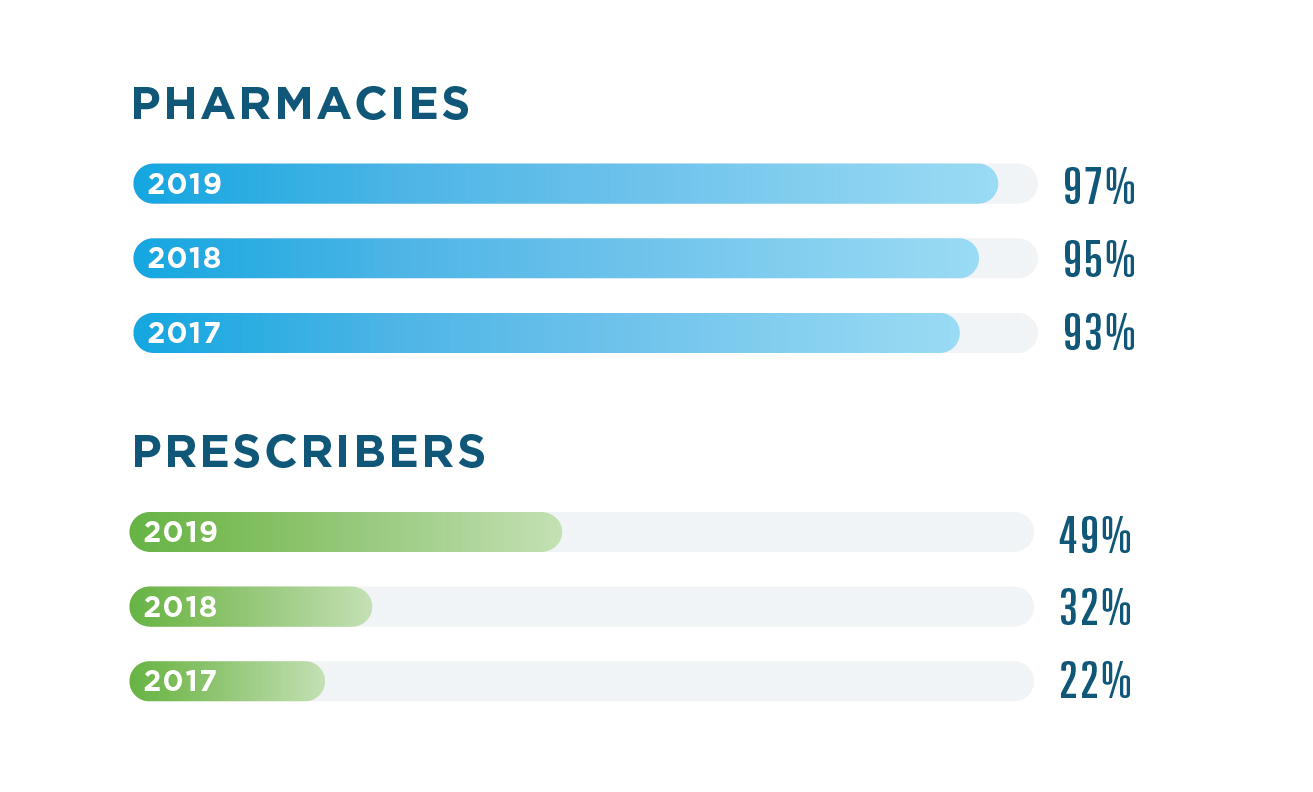
RATE OF E-PRESCRIBING
.jpg)
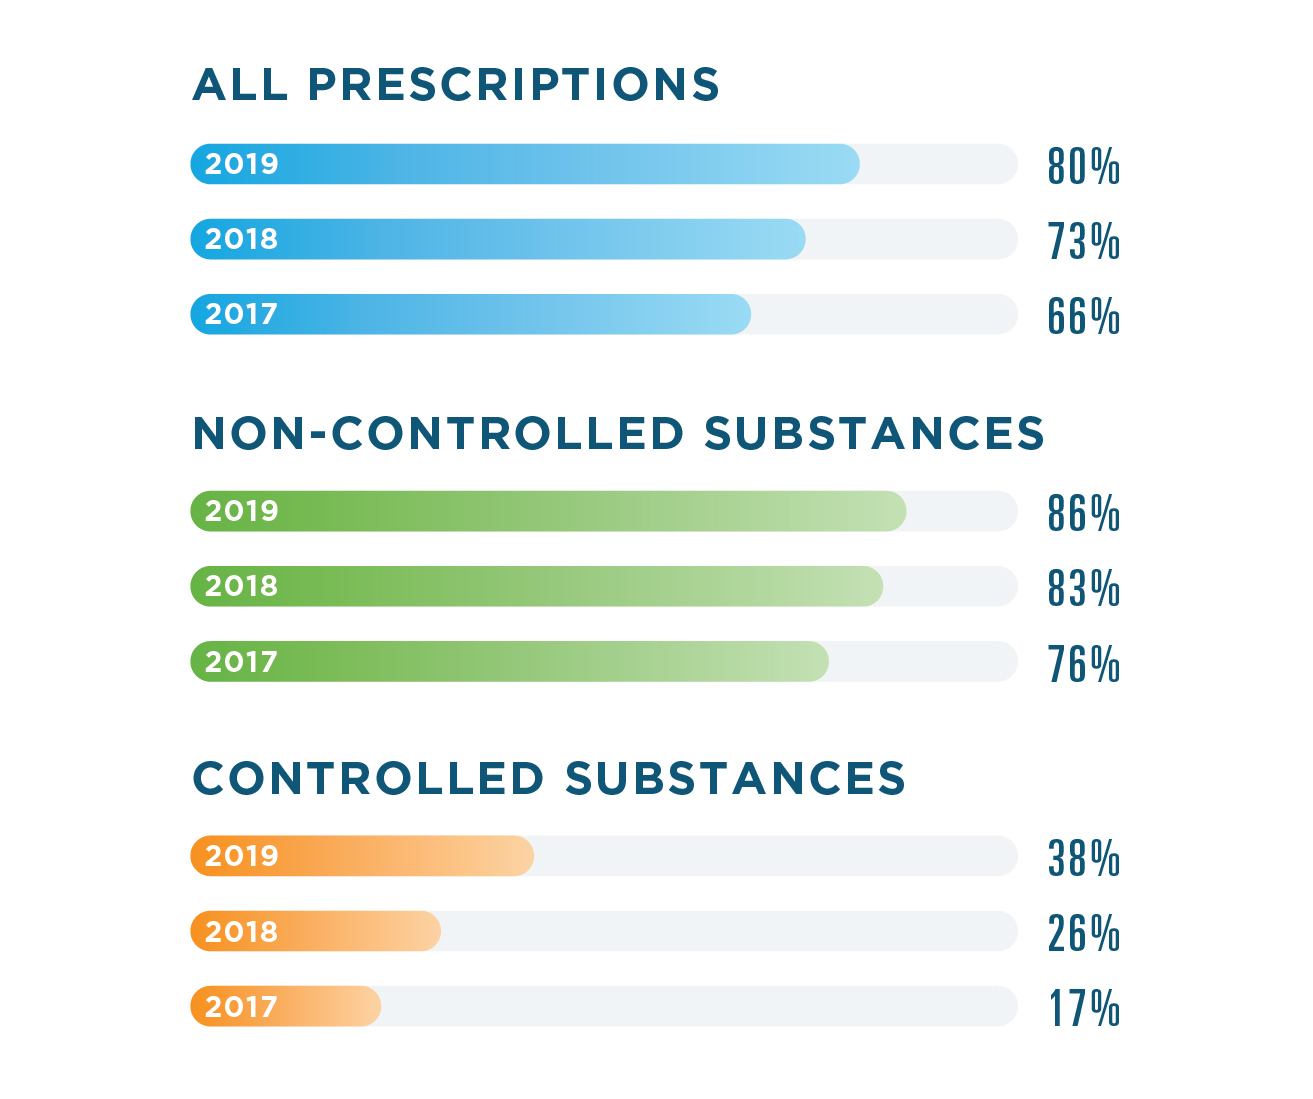
Note: Percentages calculated using data from the National Association of Chain Drug Stores.
Historically, Surescripts has reported on the number of prescriptions written electronically nationwide. Going forward, we will be reporting the number of prescriptions filled by retail and mail-order pharmacies to more accurately reflect the state of industry progress. Surescripts estimates that 84% of prescriptions are dispensed.
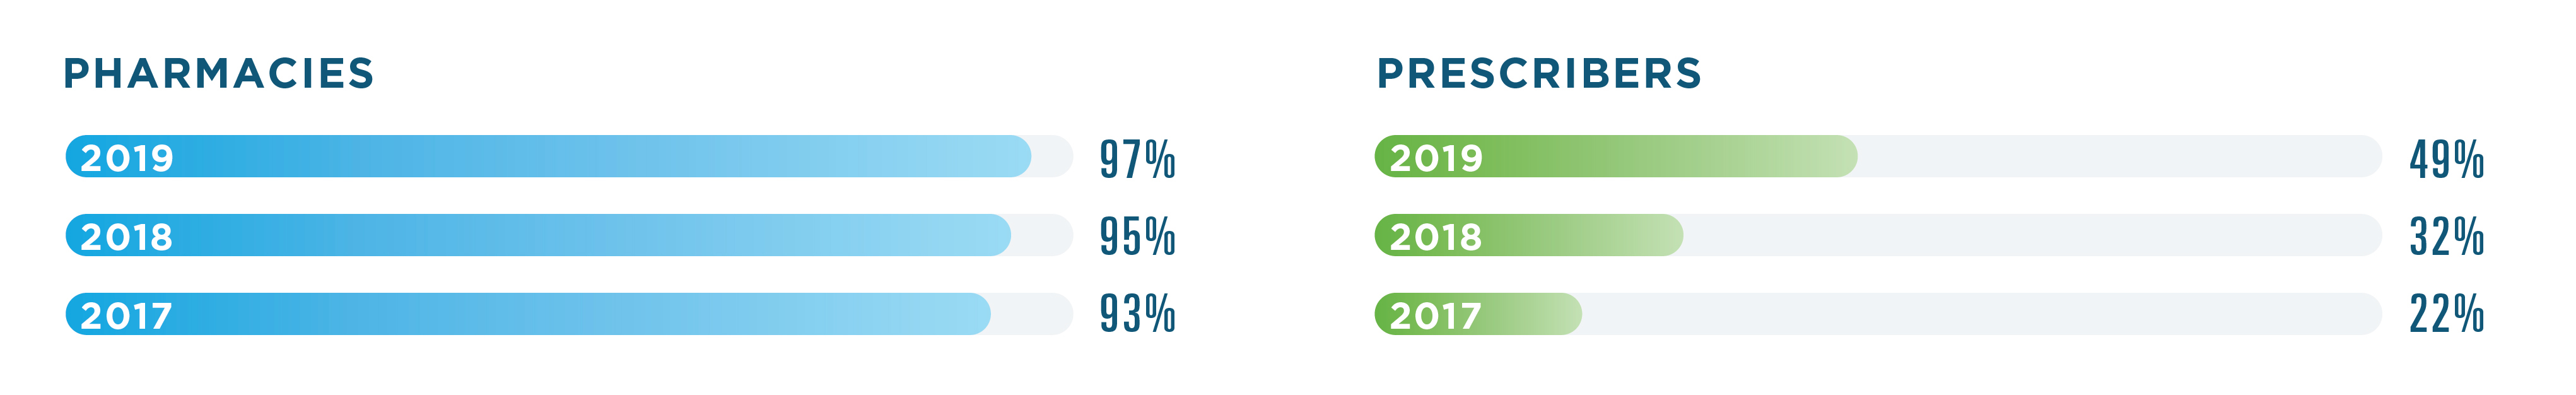
E-PRESCRIBING UTILIZATION
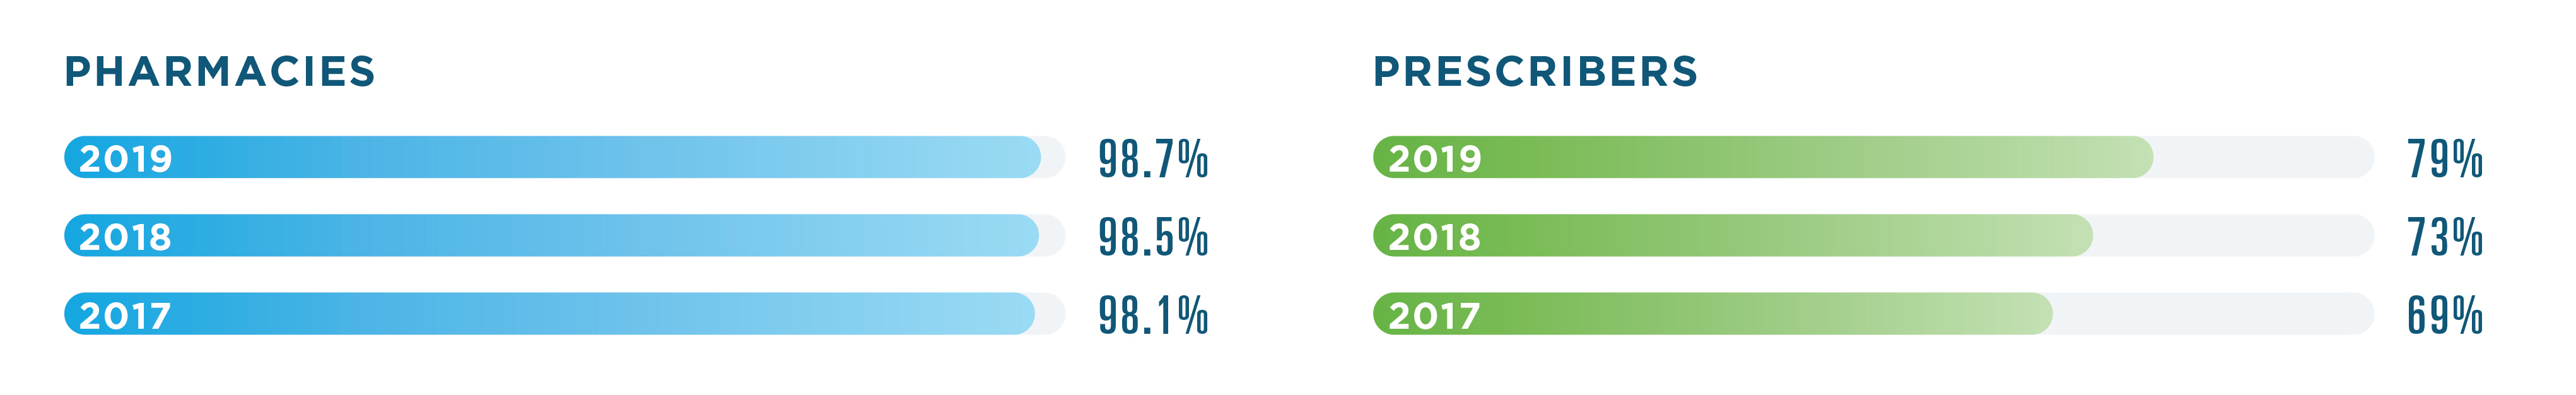
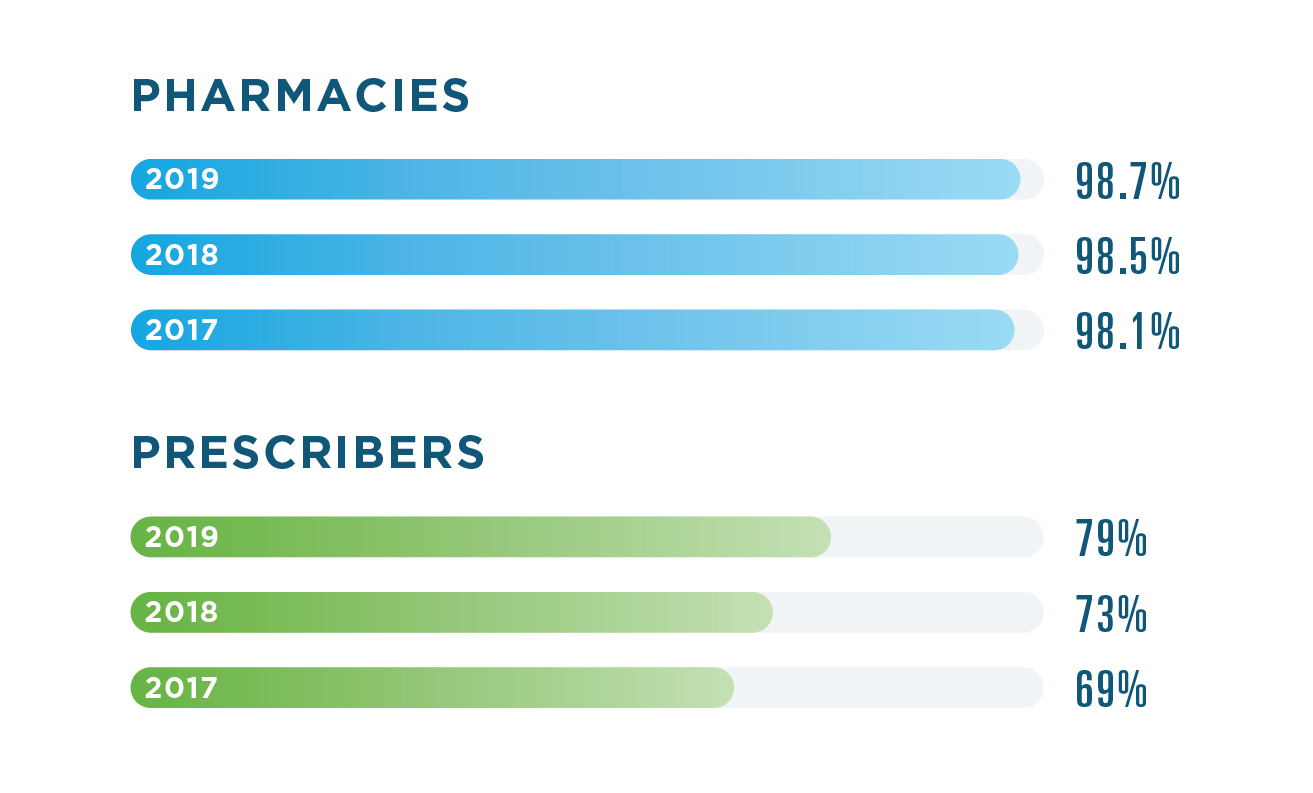
The number of prescribers utilizing E-Prescribing increased more than 8% in 2019.
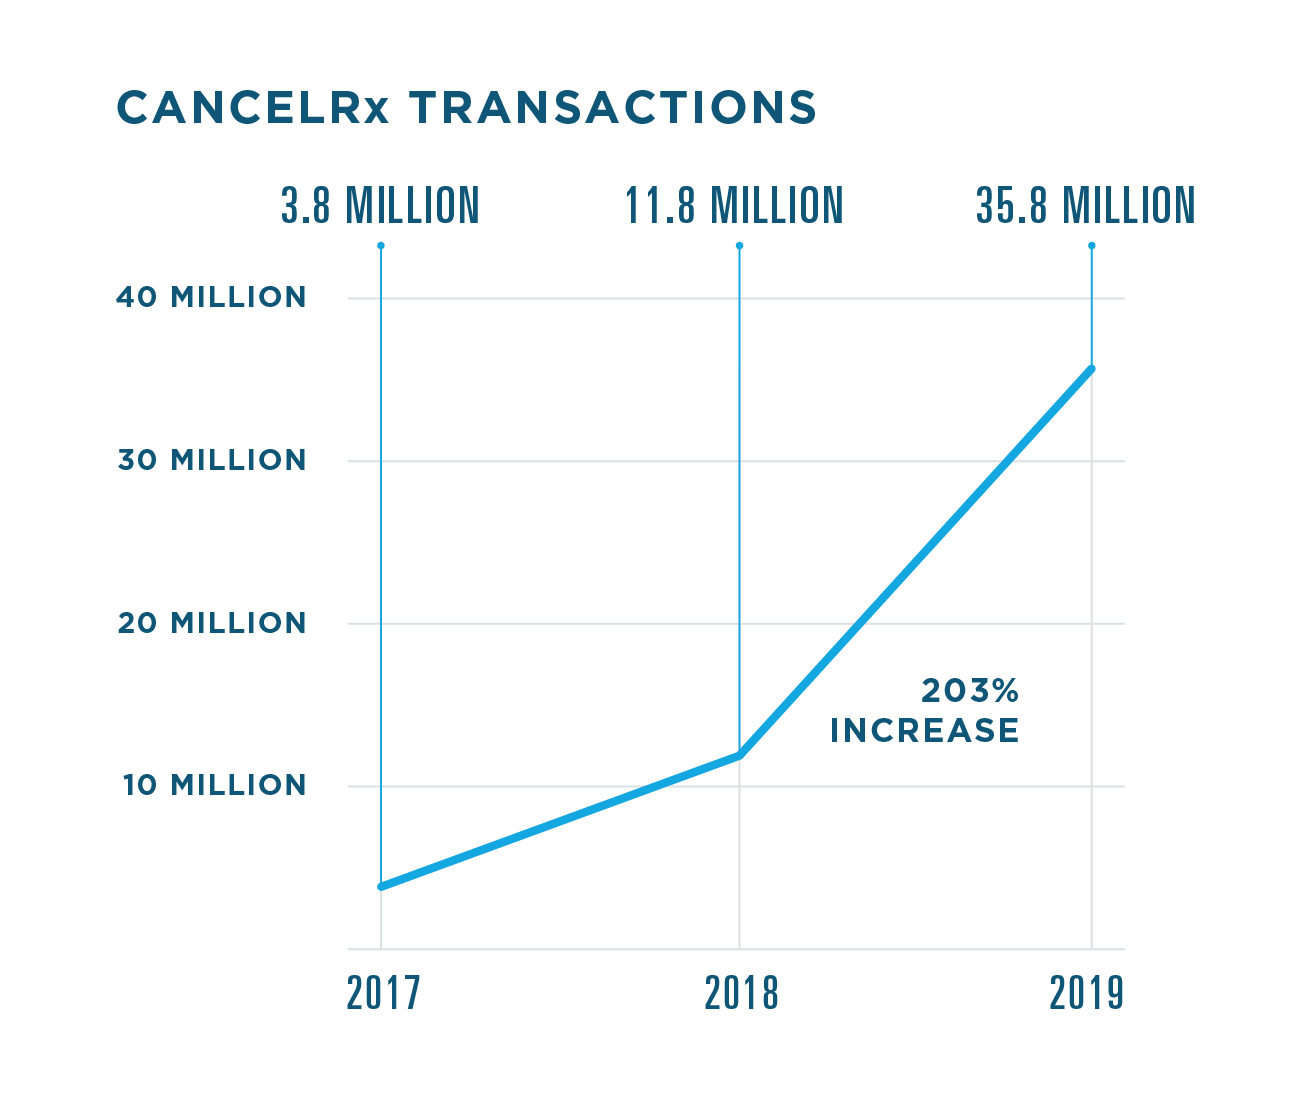
SPOTLIGHT: CANCELRX
In 2019, we saw more and more clinicians implementing workflow and technology changes, like the CancelRx transaction, to improve prescription accuracy and patient safety. By using CancelRx, prescribers can securely and reliably notify the pharmacy of the need to cancel a prescription, which stops automatic refills and eliminates the need for time-consuming phone calls and faxes.
.jpg)
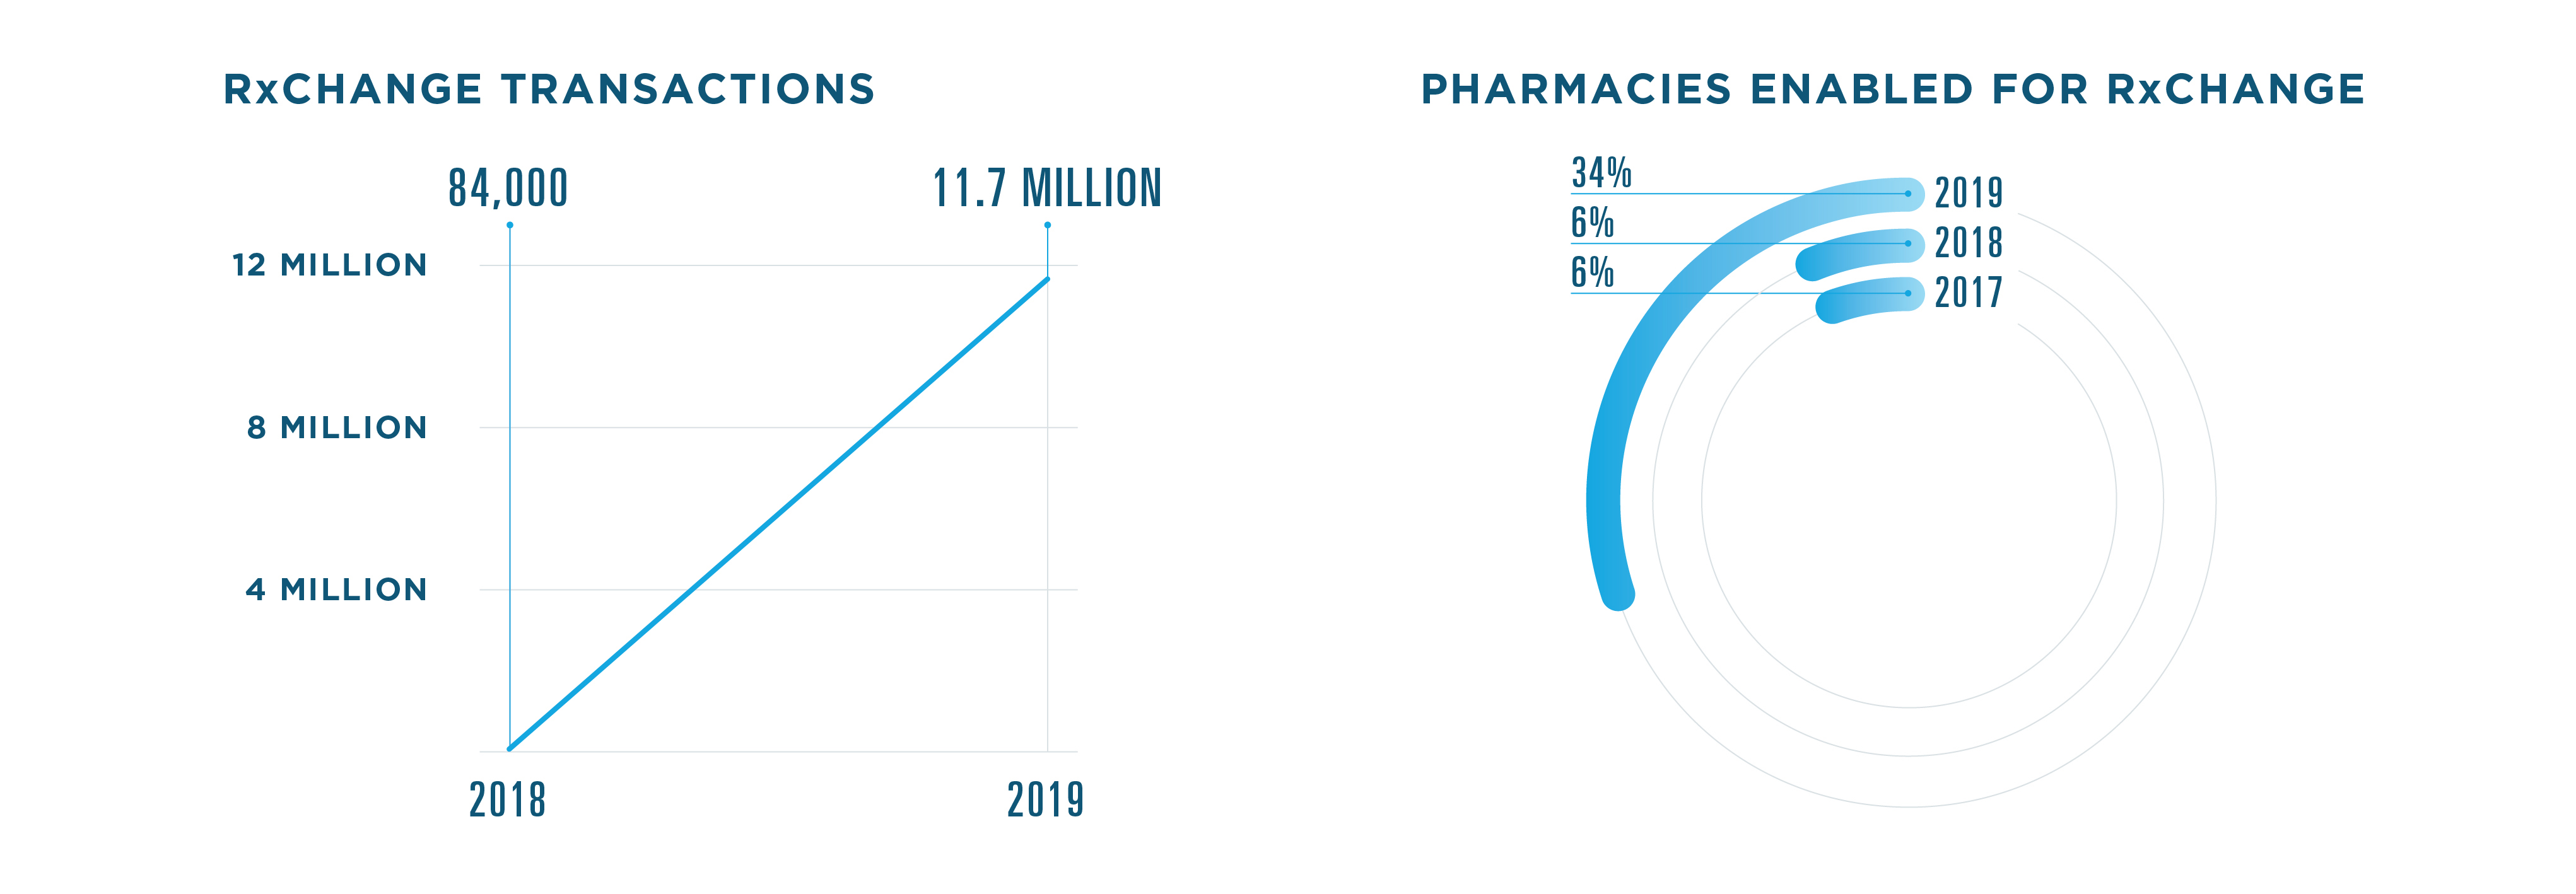
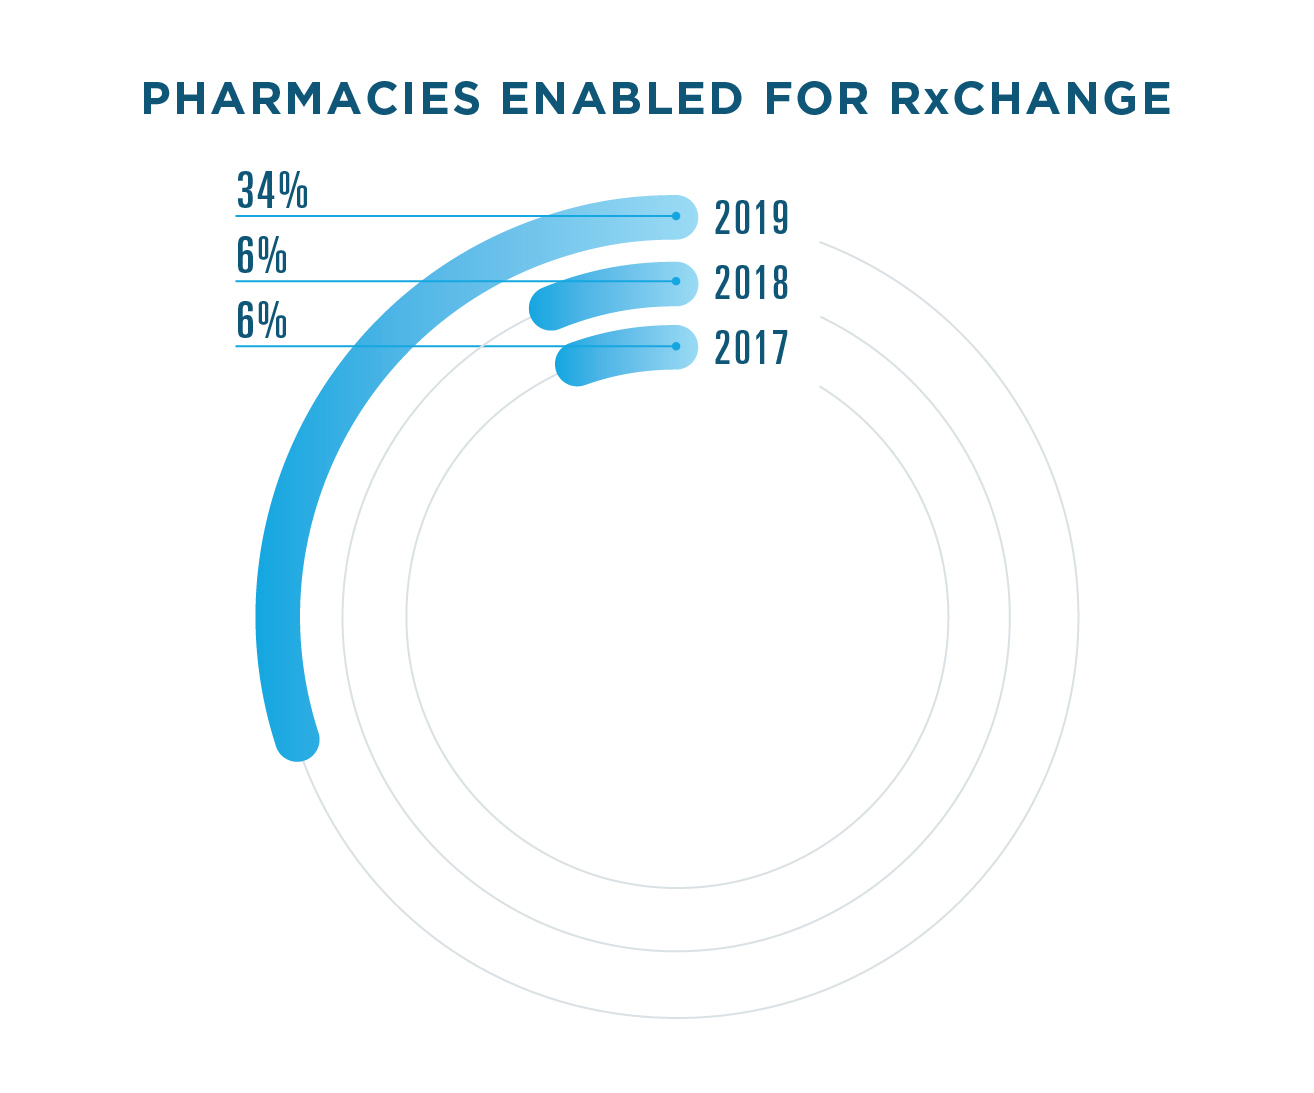
SPOTLIGHT: RXCHANGE
Pharmacists often play a critical role in optimizing medication therapy, and RxChange gives them a quicker, easier way to collaborate with prescribers. In 2019, the Surescripts network saw considerable growth in the use of RxChange, particularly three unique use cases, including RxChange for Prior Authorization, RxChange for Therapeutic Interchange and RxChange for Generic Substitution.
ELECTRONIC PRESCRIBING FOR CONTROLLED SUBSTANCES (EPCS)
In 2019, more healthcare professionals saw the safety and efficiency benefits of EPCS—and put it into action for their patients. Compared to 2018, 51% more prescribers were enabled for EPCS.
PERCENT ENABLED FOR EPCS
TOP 5 SPECIALTIES USING EPCS
.jpg)
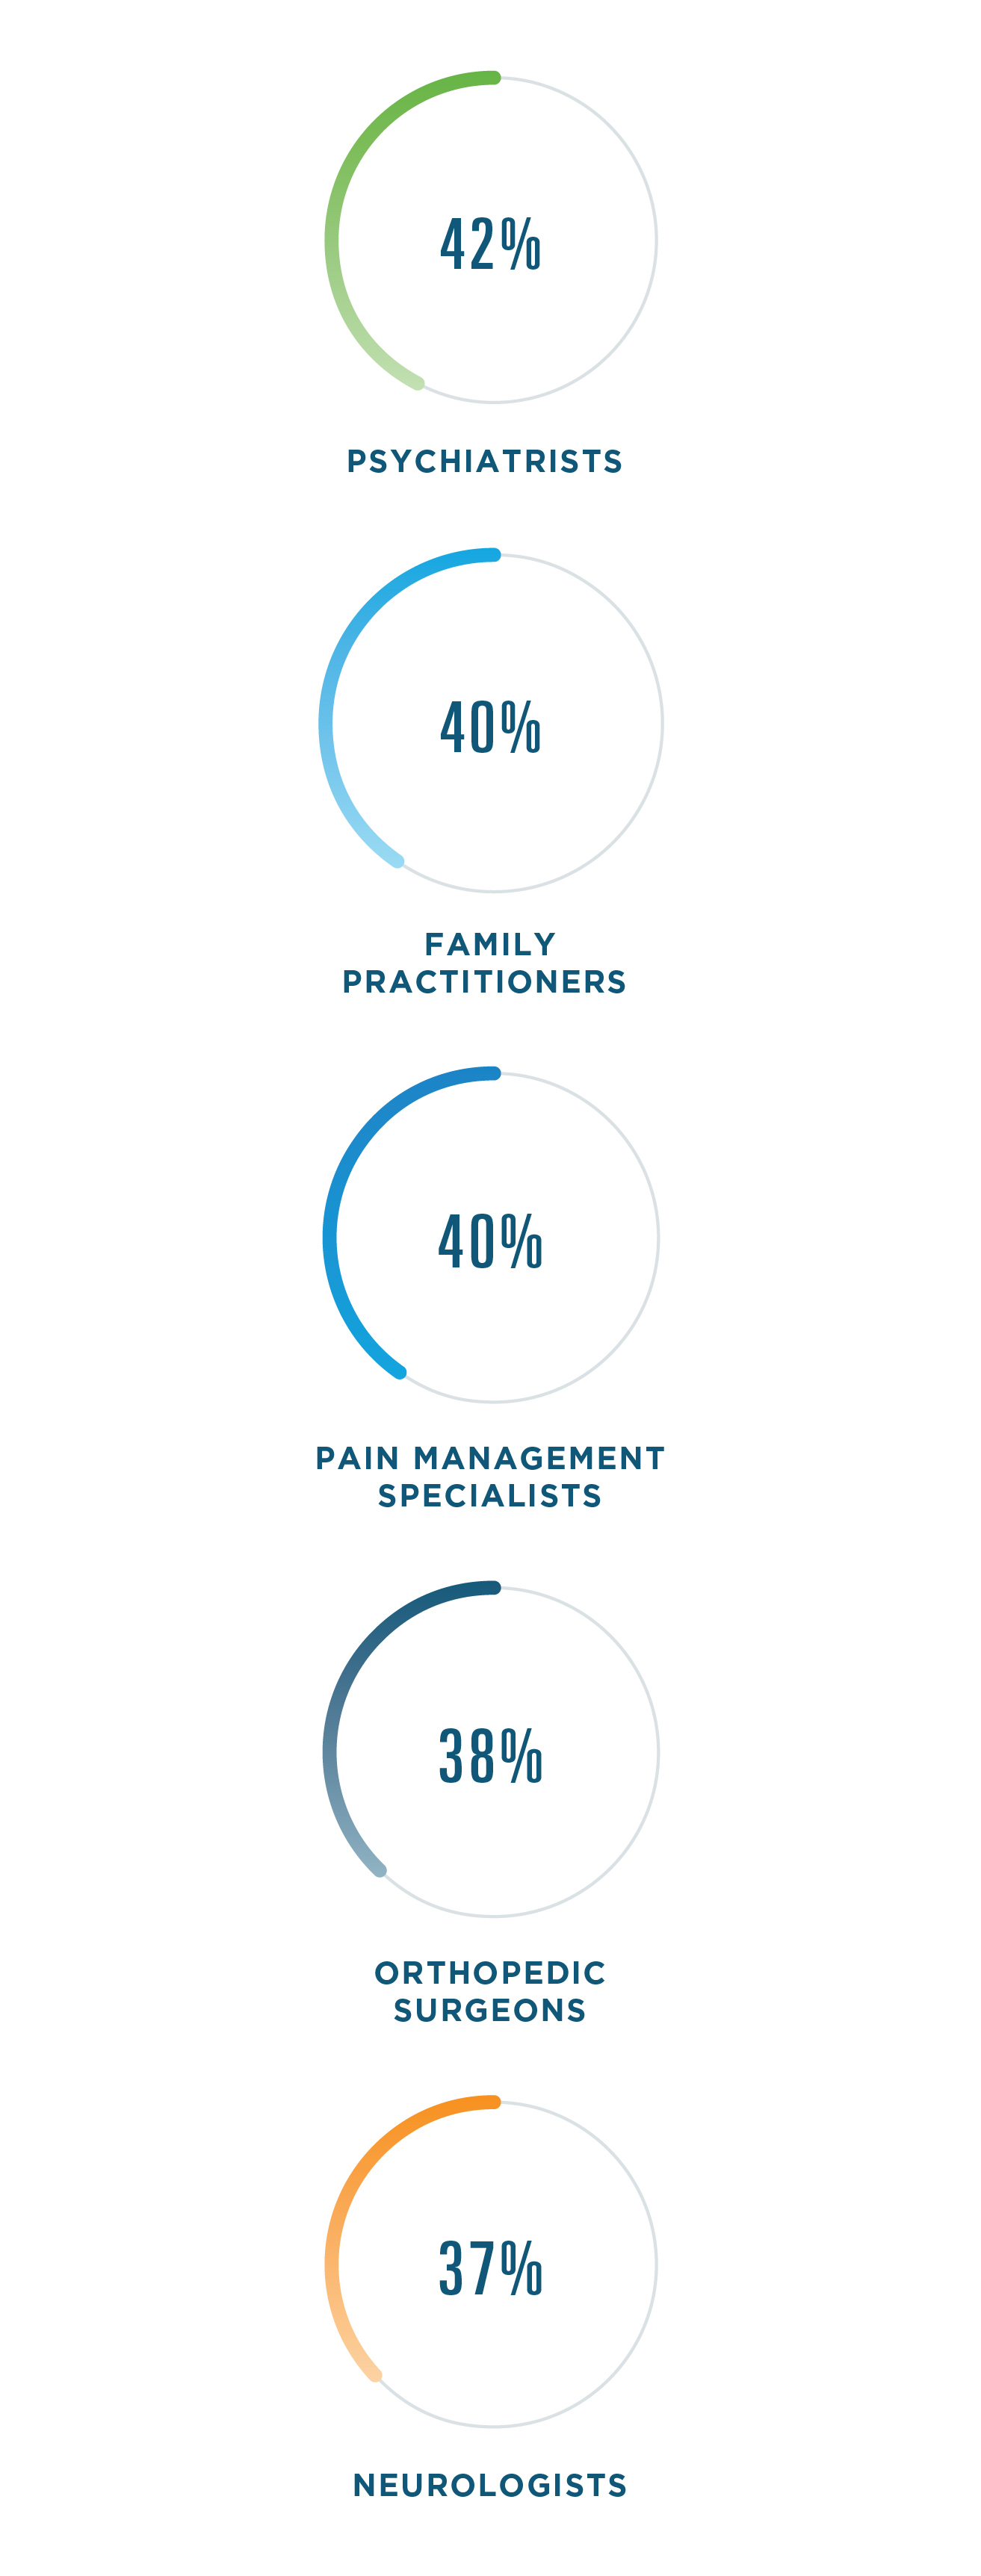
Family practice saw the largest increase, growing more than 7% in 2019.
SPOTLIGHT: OPIOIDS
In response to the nation’s opioid crisis, opioid prescribing rates have been declining for several years now.8, 9 In 2019, we saw more opioid prescriptions written electronically, helping guard against prescription fraud and abuse.
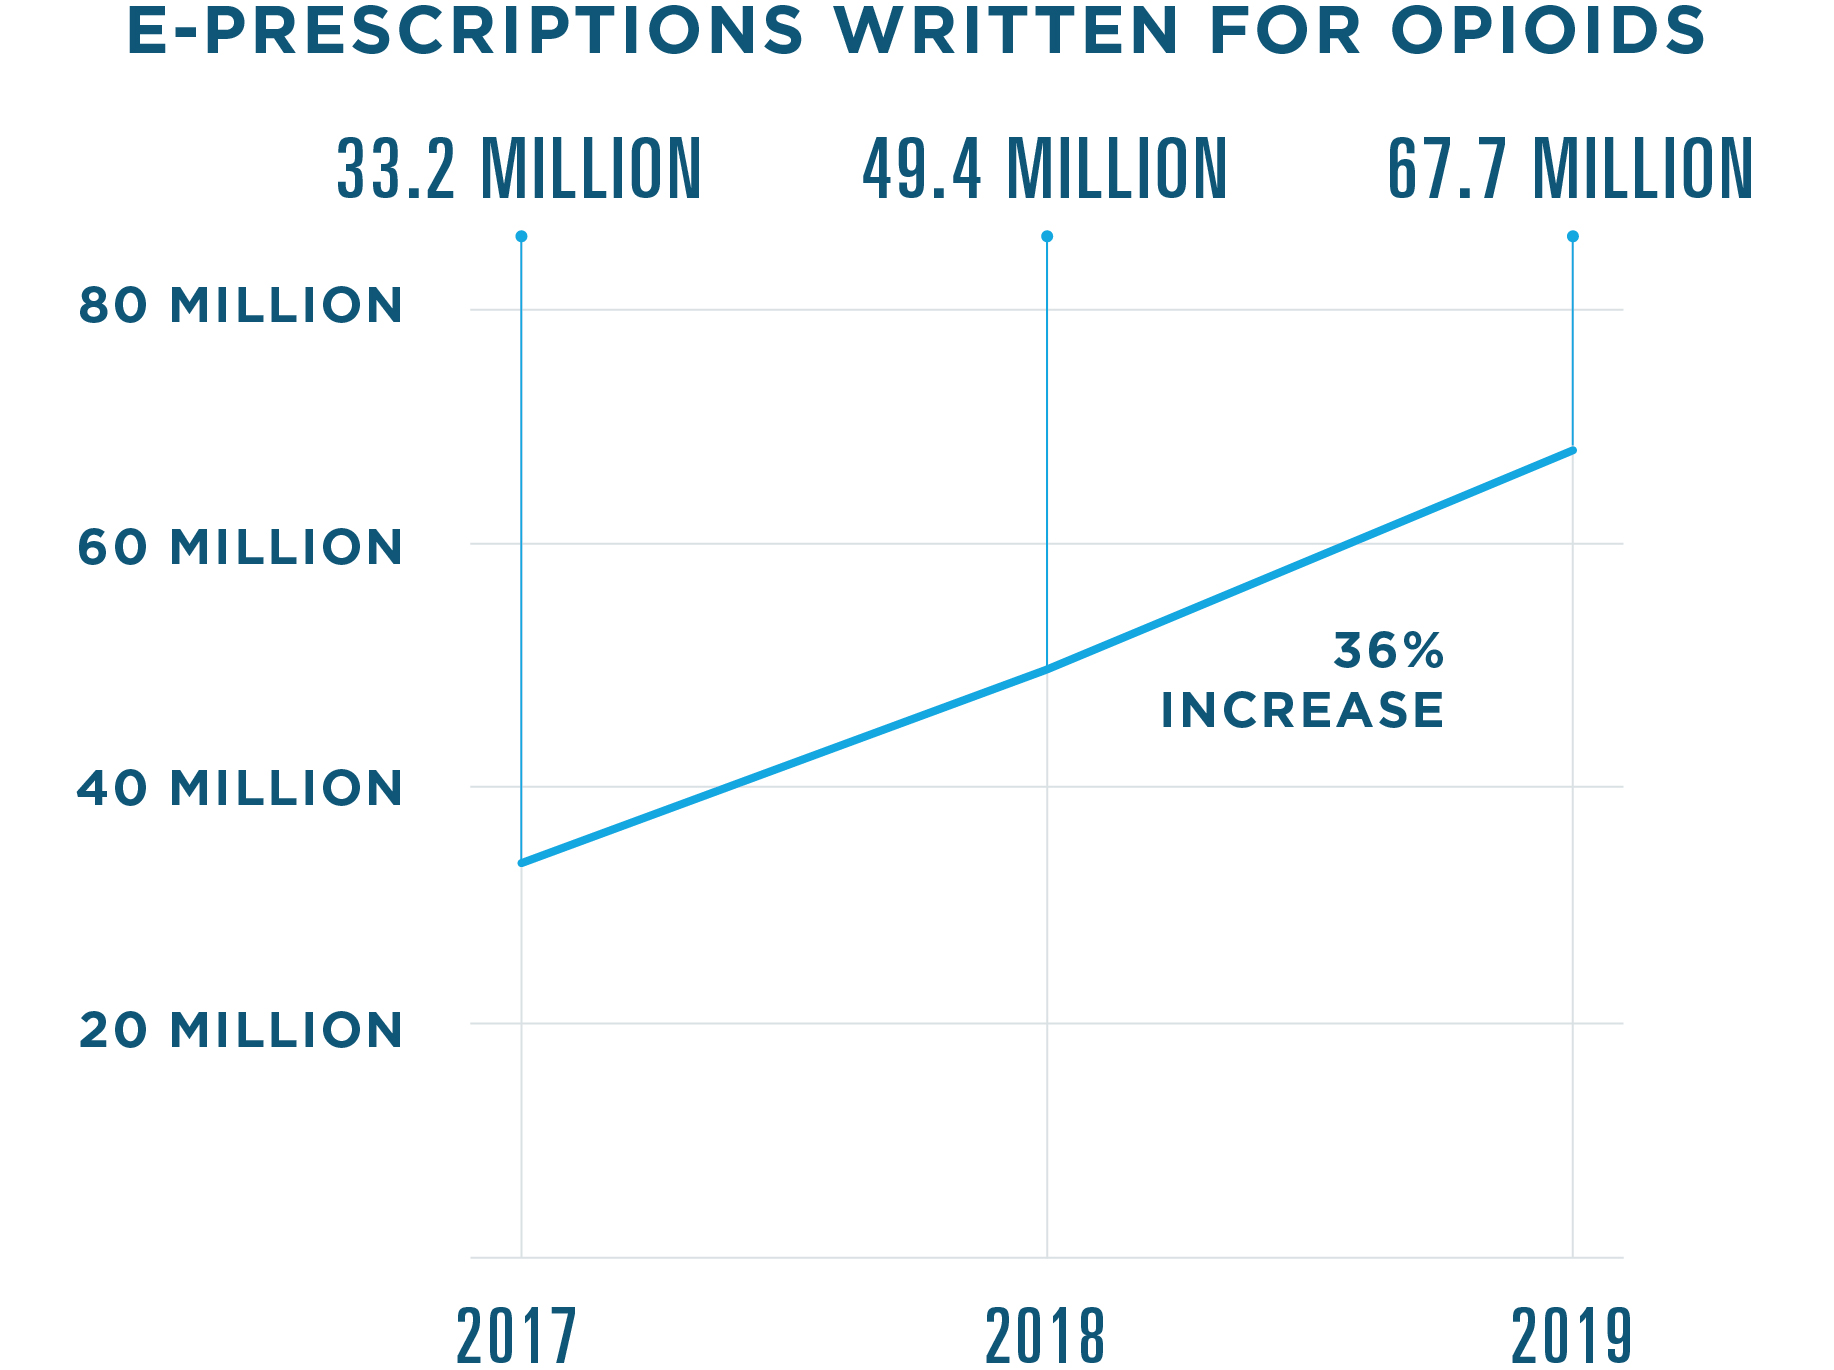
Note: This data includes opioid prescriptions written electronically. Other e-prescribing data in this report considers only prescriptions filled.
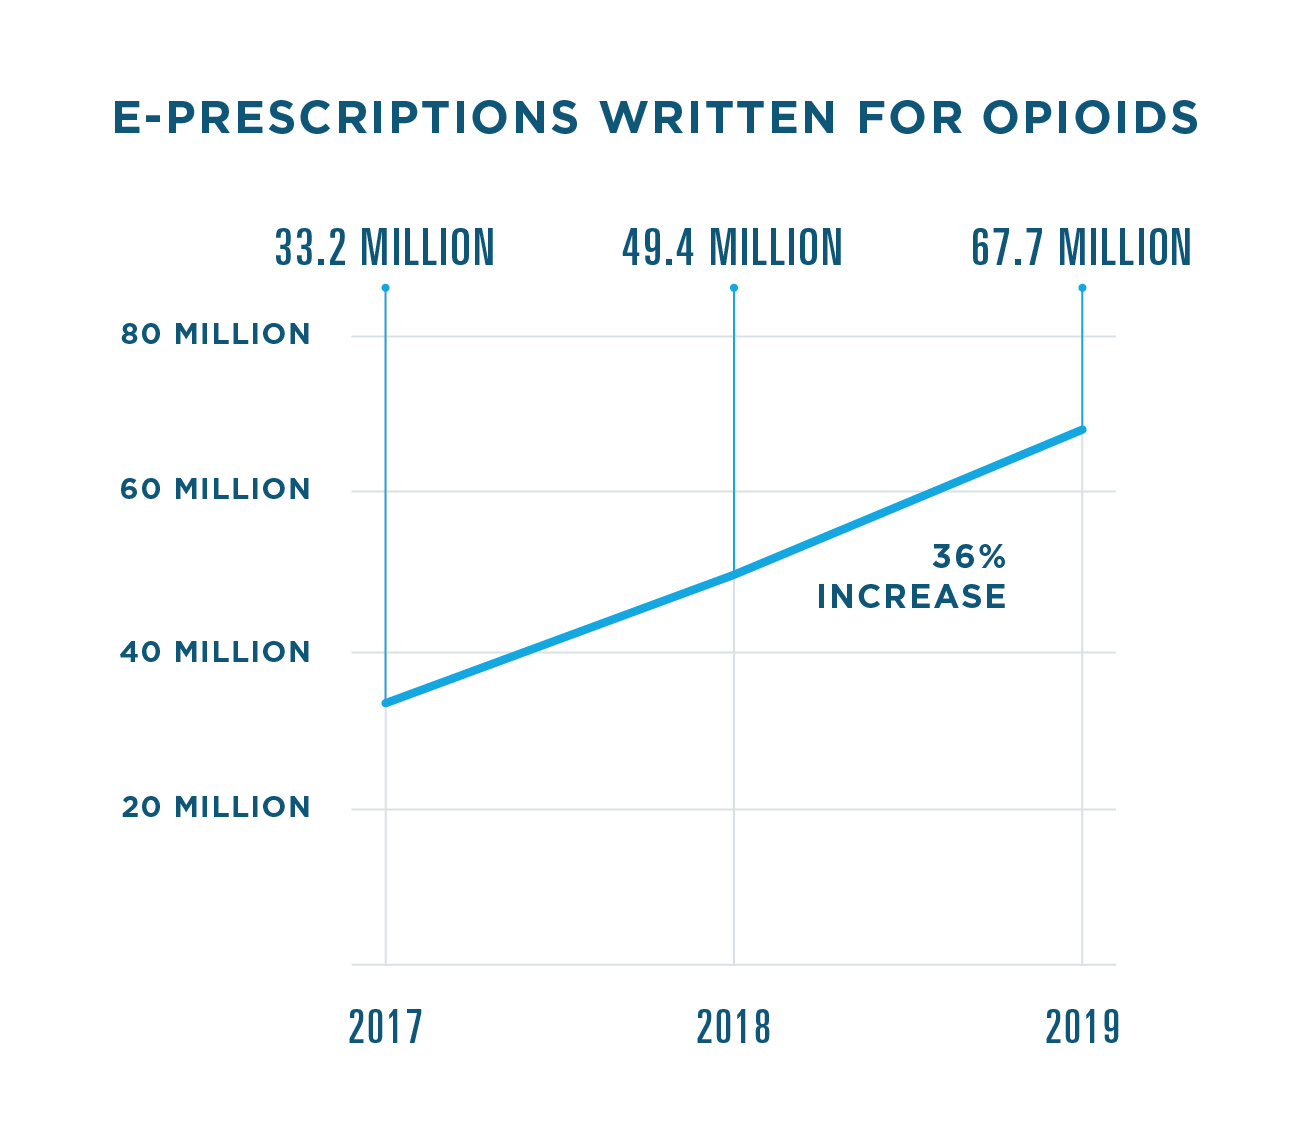
Note: This data includes opioid prescriptions written electronically. Other e-prescribing data in this report considers only prescriptions filled.
Top 5 Opioid E-Prescriptions Written
In 2019, five opioids accounted for 88% of all opioid e-prescriptions written.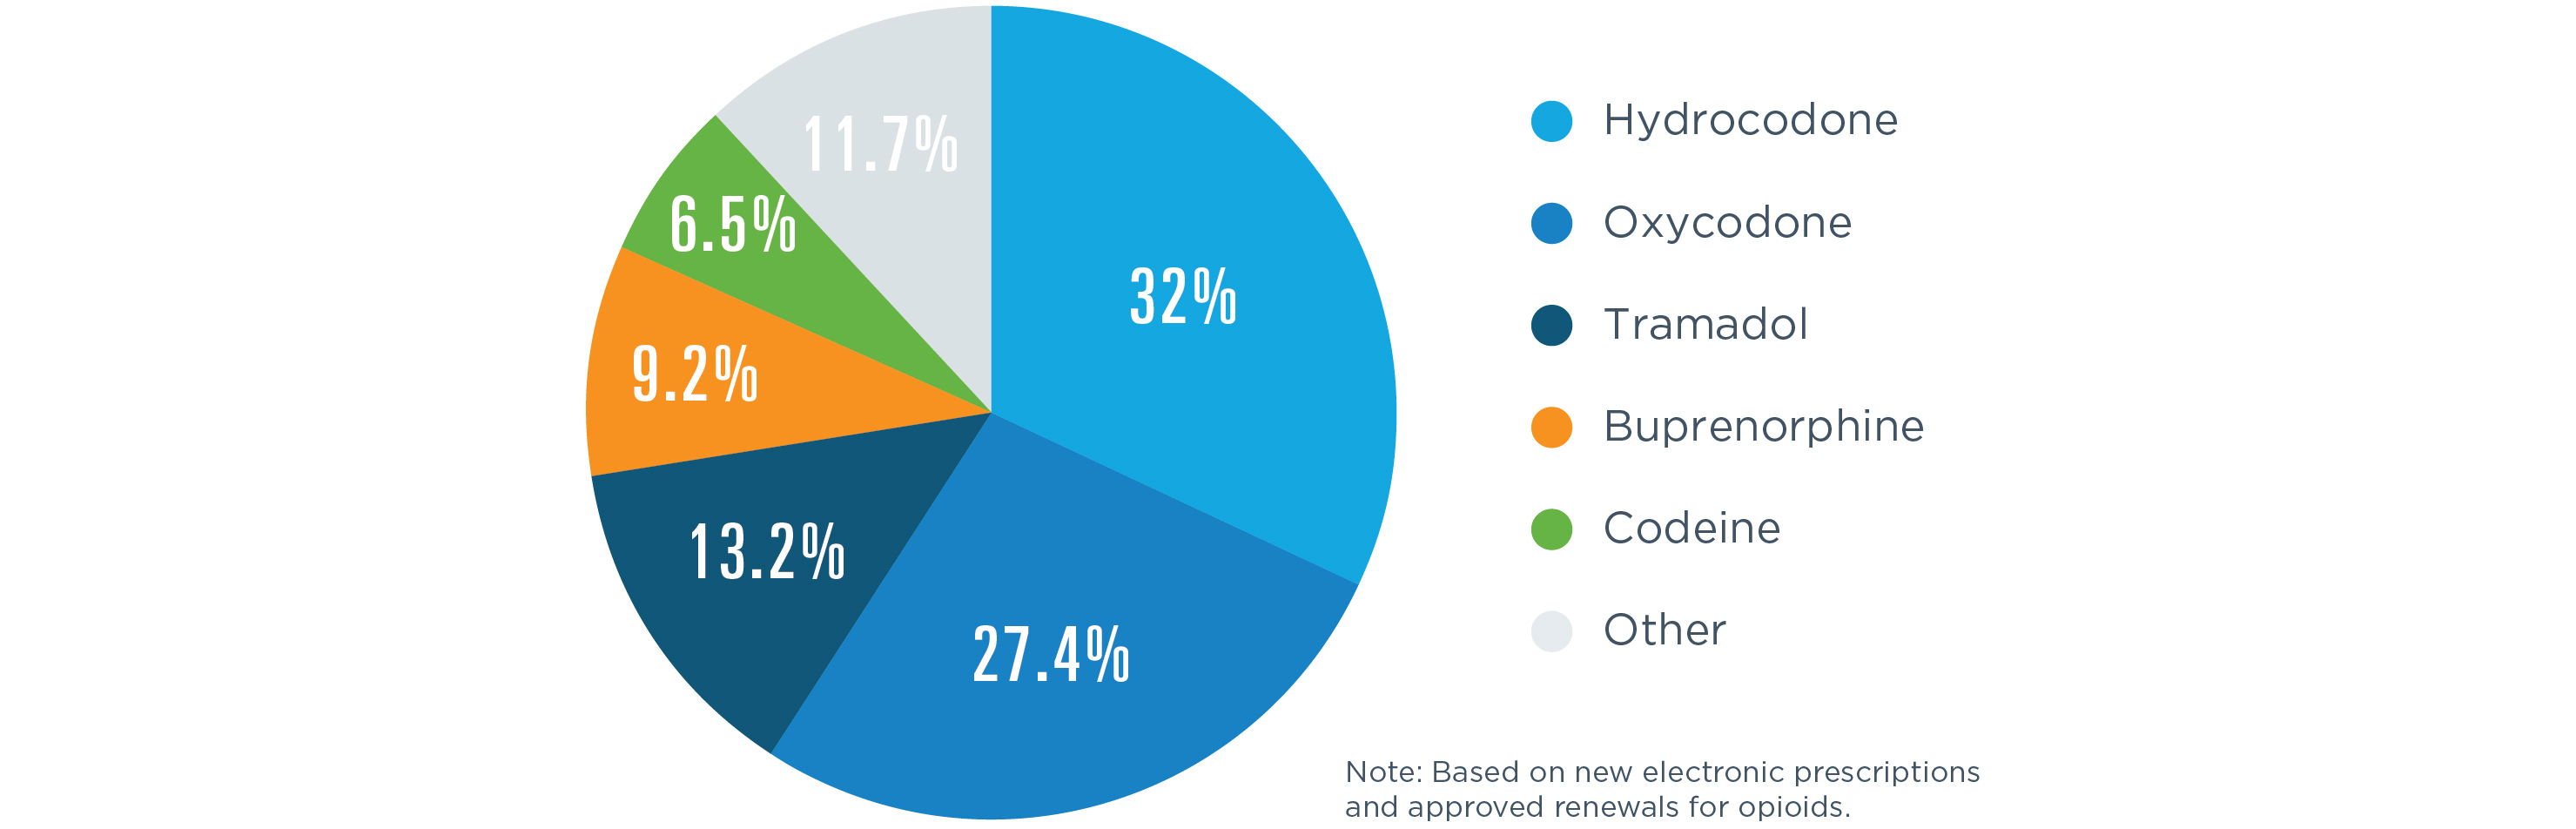
EPCS Legislation On the Move
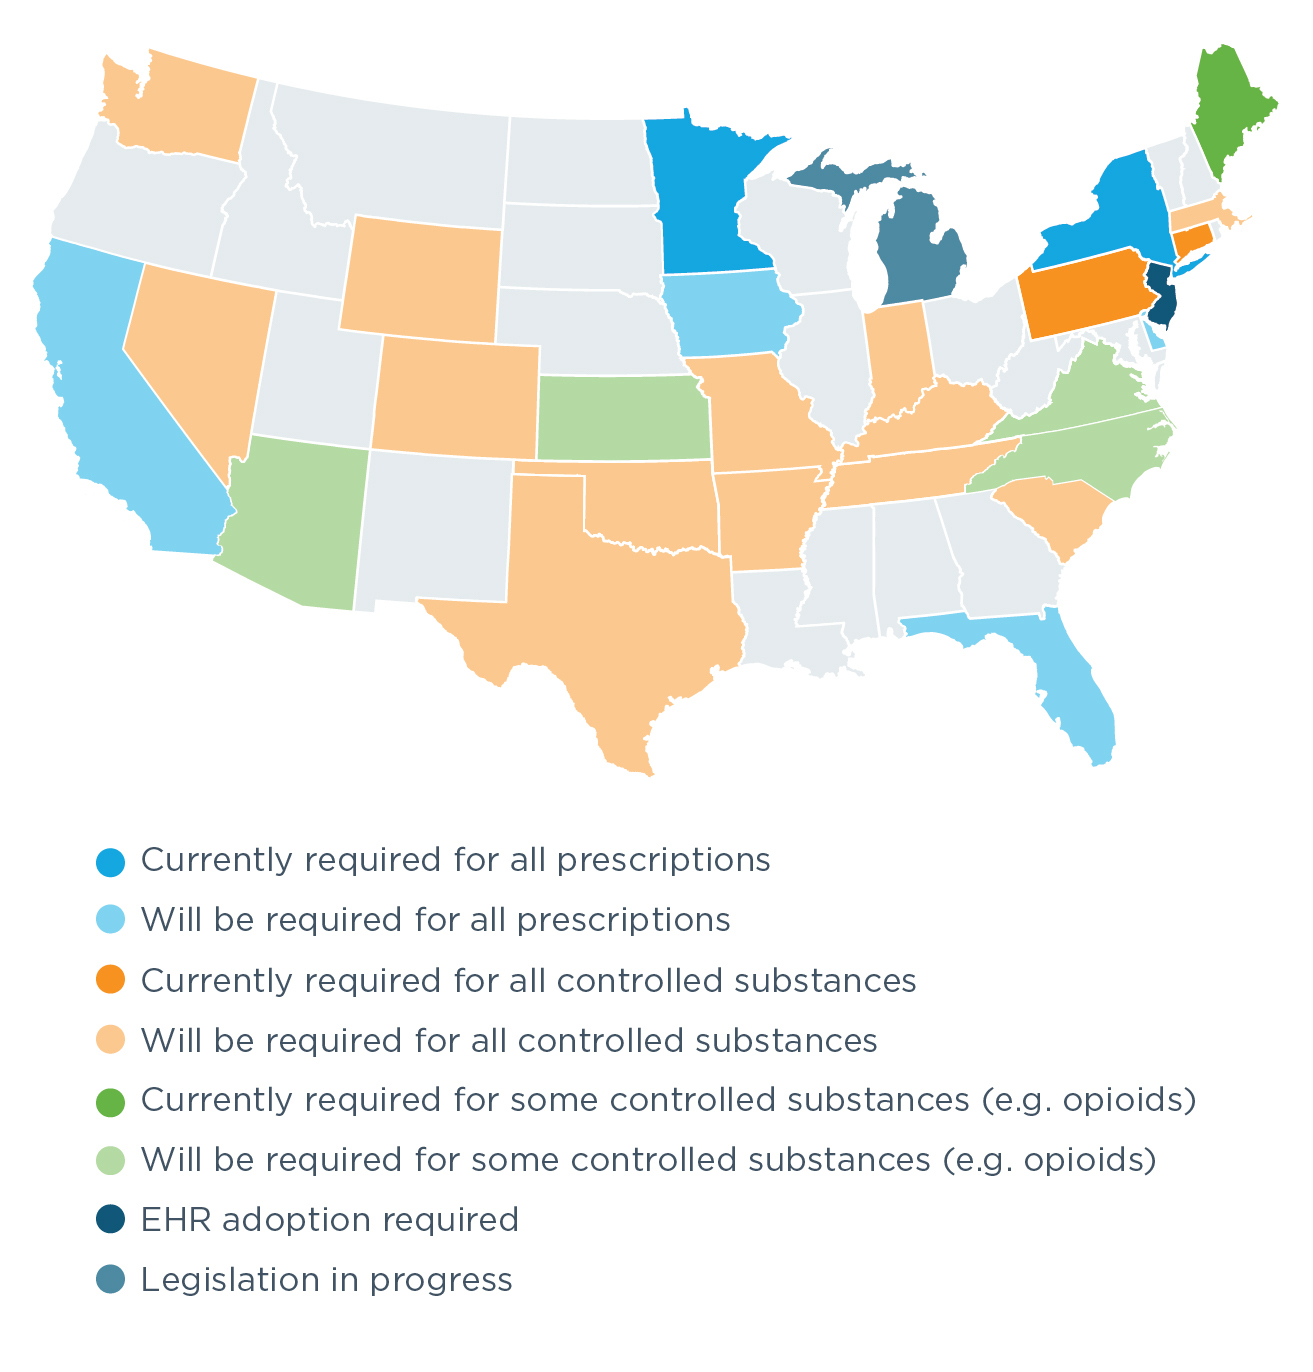
With 13 states enacting e-prescribing requirements in 2019, more than half of all states now require e-prescribing for opioids, all controlled substances or all prescriptions. As provider enablement for EPCS rises in these states, we can also expect further advances spurred by the Substance Use-Disorder Prevention That Promotes Opioid Recovery and Treatment (SUPPORT) for Patients and Communities Act, which requires that controlled substance prescriptions covered under Medicare Part D be transmitted electronically as of January 1, 2021.
WHERE IS E-PRESCRIBING REQUIRED BY LAW?
.jpg)
EPCS STATE RANKINGS
| 2019 Rank | 2018 Rank | State | Pharmacy Enablement | Prescriber Enablement | Controlled Substances Prescribed Electronically |
|---|
New York maintained its longstanding position as the nation’s leader in EPCS enablement, having required e-prescribing for all prescriptions since 2016.
Maine and Connecticut held their ranks as second and third in the nation following controlled substance e-prescribing mandates that took effect in mid-2017 and January 2018, respectively.
Arizona delayed its e-prescribing requirement for opioids until January 1, 2020, but the state still made gains in 2019: It leapt from 11th place to fourth.
Oklahoma saw the largest rank increase in the nation, moving up 18 spots in 2019. Its e-prescribing requirement was enacted in May 2018 and became effective January 1, 2020.
How State Mandates Spur EPCS Enablement
.jpg)
.jpg)
New York, Maine and Connecticut
started the year with mandates in place. So did
Minnesota, though its requirement has no specific penalties for noncompliance.
Pennsylvania's
mandate took effect October 24, 2019.
Arizona, Florida, Iowa, North Carolina, Oklahoma and Rhode Island
had mandates set to take effect January 1, 2020.
ELECTRONIC PRIOR AUTHORIZATION
In 2019, Surescripts continued to focus on improving the
prior authorization
experience by streamlining workflows and expanding our network to include new data suppliers.
We also worked closely across the industry to build alignment around automating and improving the process for patients and providers. Just after the new year, America’s Health Insurance Plans announced that it would leverage Surescripts
Electronic Prior Authorization
as part of its Fast Prior Authorization Technology Highway (Fast PATH) initiative, with the potential to benefit the 60 million patients covered by participating plans.10
- 132% increase in prior authorizations processed electronically
- PBMs and health plans representing 95% of U.S. patients have contracted to provide data for the service
- 82% of U.S. prescribers are served by EHRs contracted for the service
- 58% increase in provider adoption
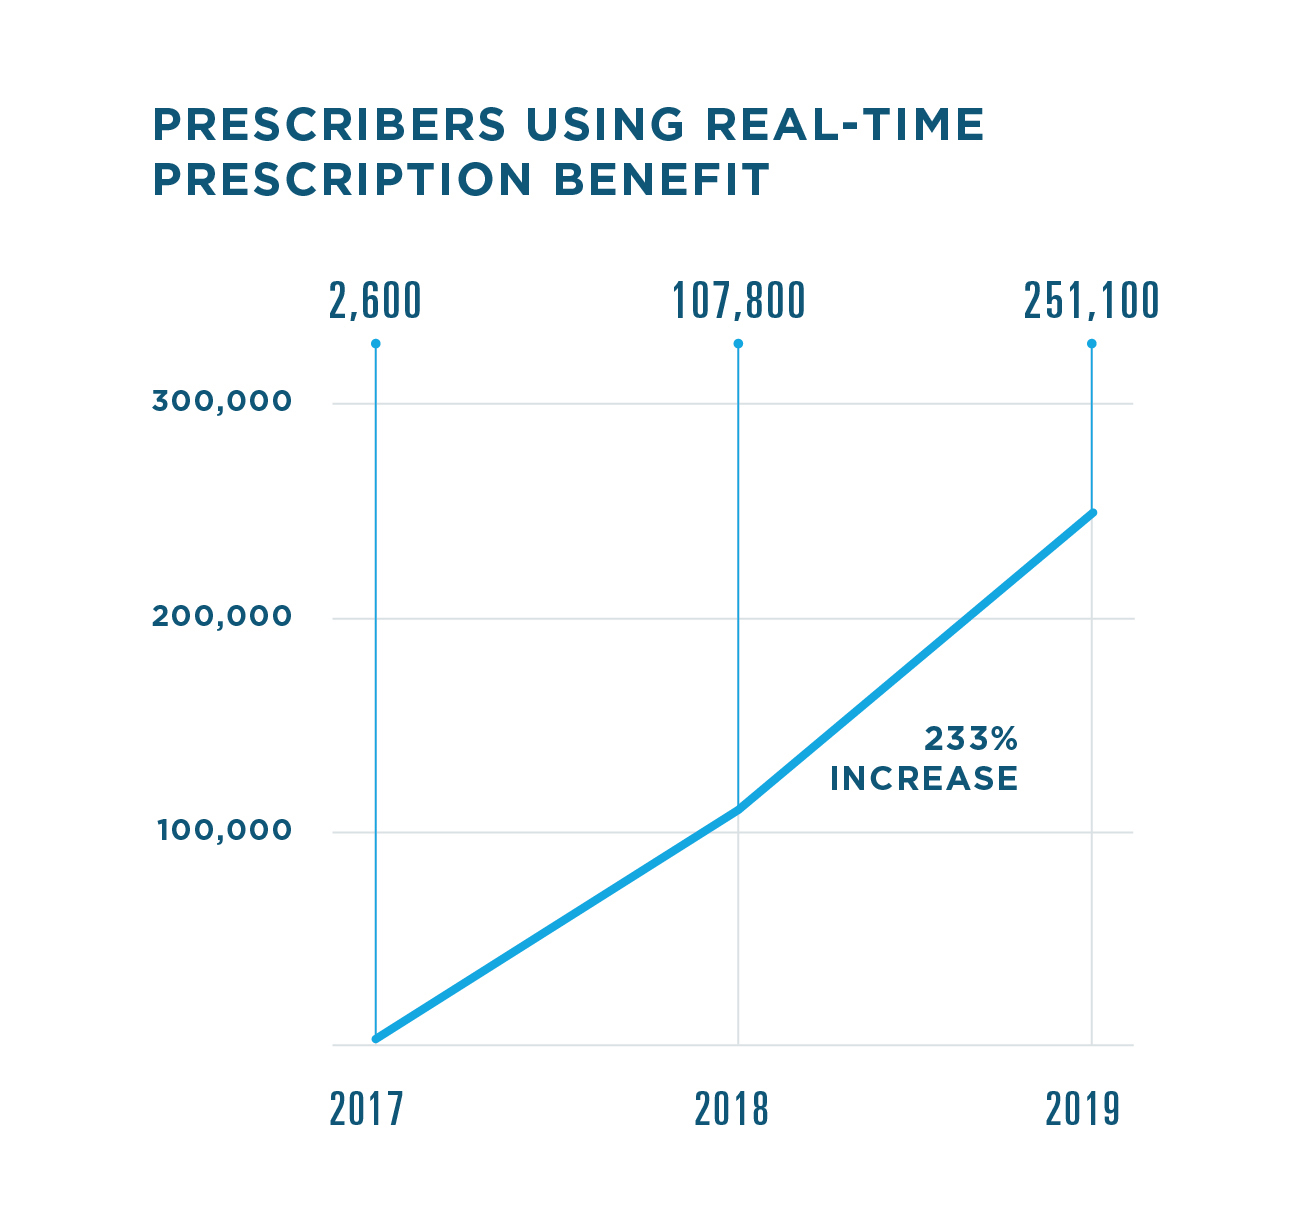
REAL-TIME PRESCRIPTION BENEFIT
Patients and clinicians value prescription price transparency, and data shows that far more of them experienced it firsthand in 2019.
- PBMs and health plans covering 79% of U.S. patients have contracted to provide data for the service
- 88% of U.S. prescribers are served by contracted EHRs (+10% in 2019)
- <2 seconds average time for prescribers to receive cost and coverage data in their EHR
.jpg)
AVERAGE SAVINGS PER PRESCRIPTION WHEN A LOWER-COST ALTERNATIVE IS CHOSEN
.jpg)
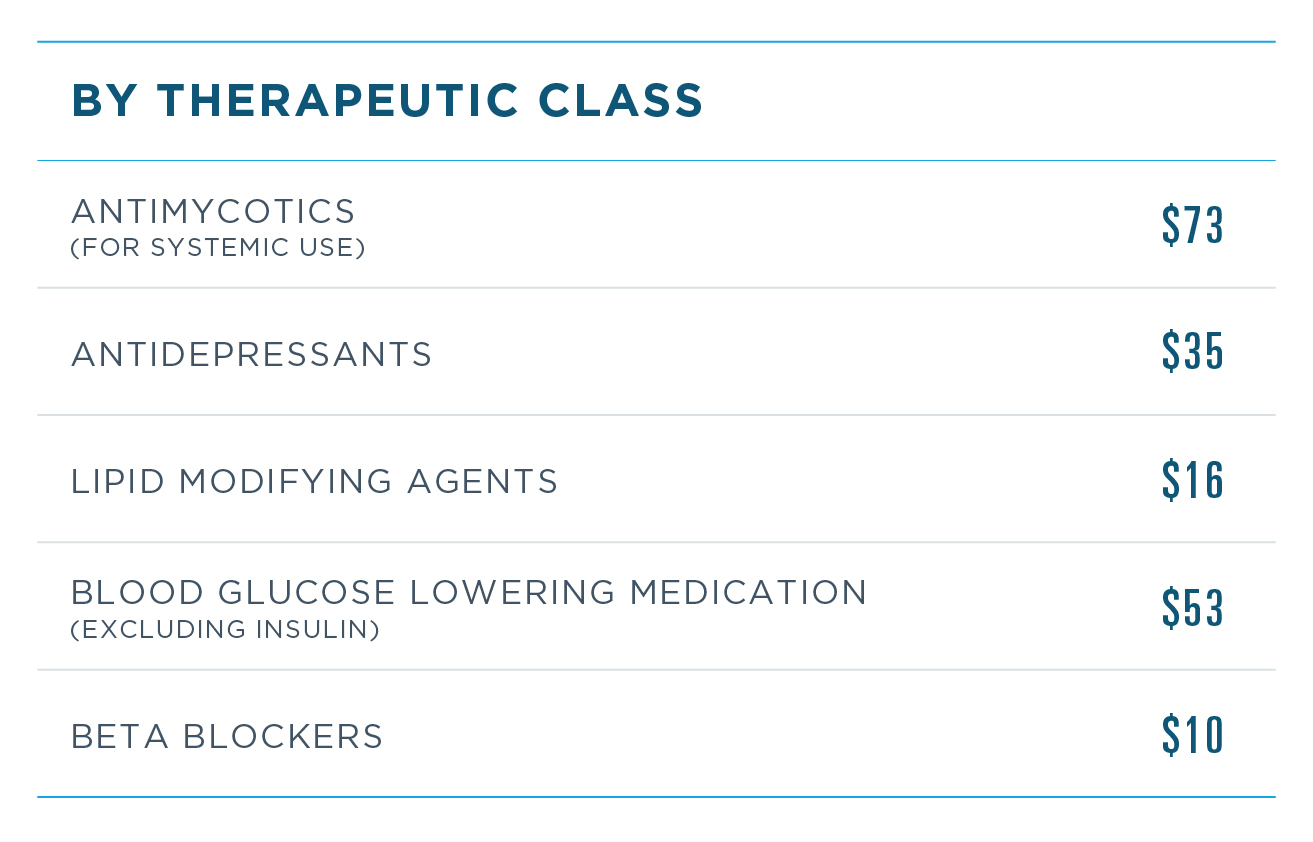
Note: Listed in order of volume. Classification based on pharmacologic class.
INFORM CARE DECISIONS
GIVING CARE TEAMS A CLEARER VIEW
MEDICATION HISTORY
In addition to delivering more medication insights in 2019, we also introduced technical improvements to eliminate redundant records and augment medication history data, ultimately improving usability and accuracy.
.jpg)
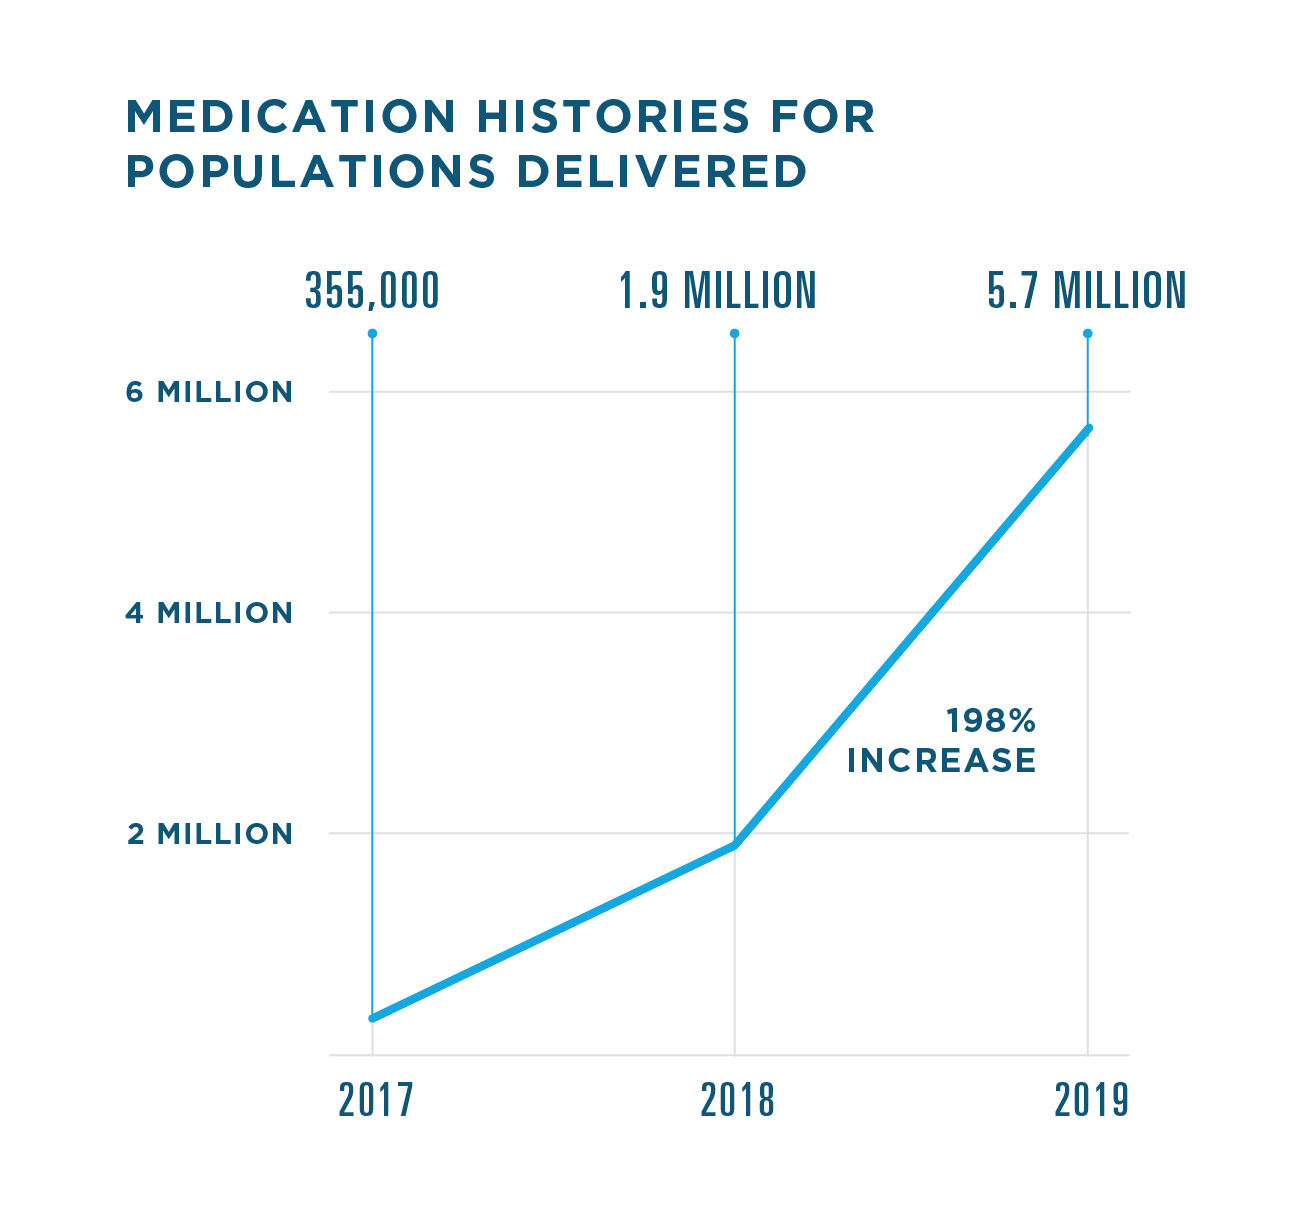
Medication History for Populations
lets healthcare providers proactively access medication history via their EHR or analytics platform to help identify and close gaps in care, uncover medication non-adherence and manage at-risk patient populations.
* Includes only medication history data supplied by pharmacy benefit managers.
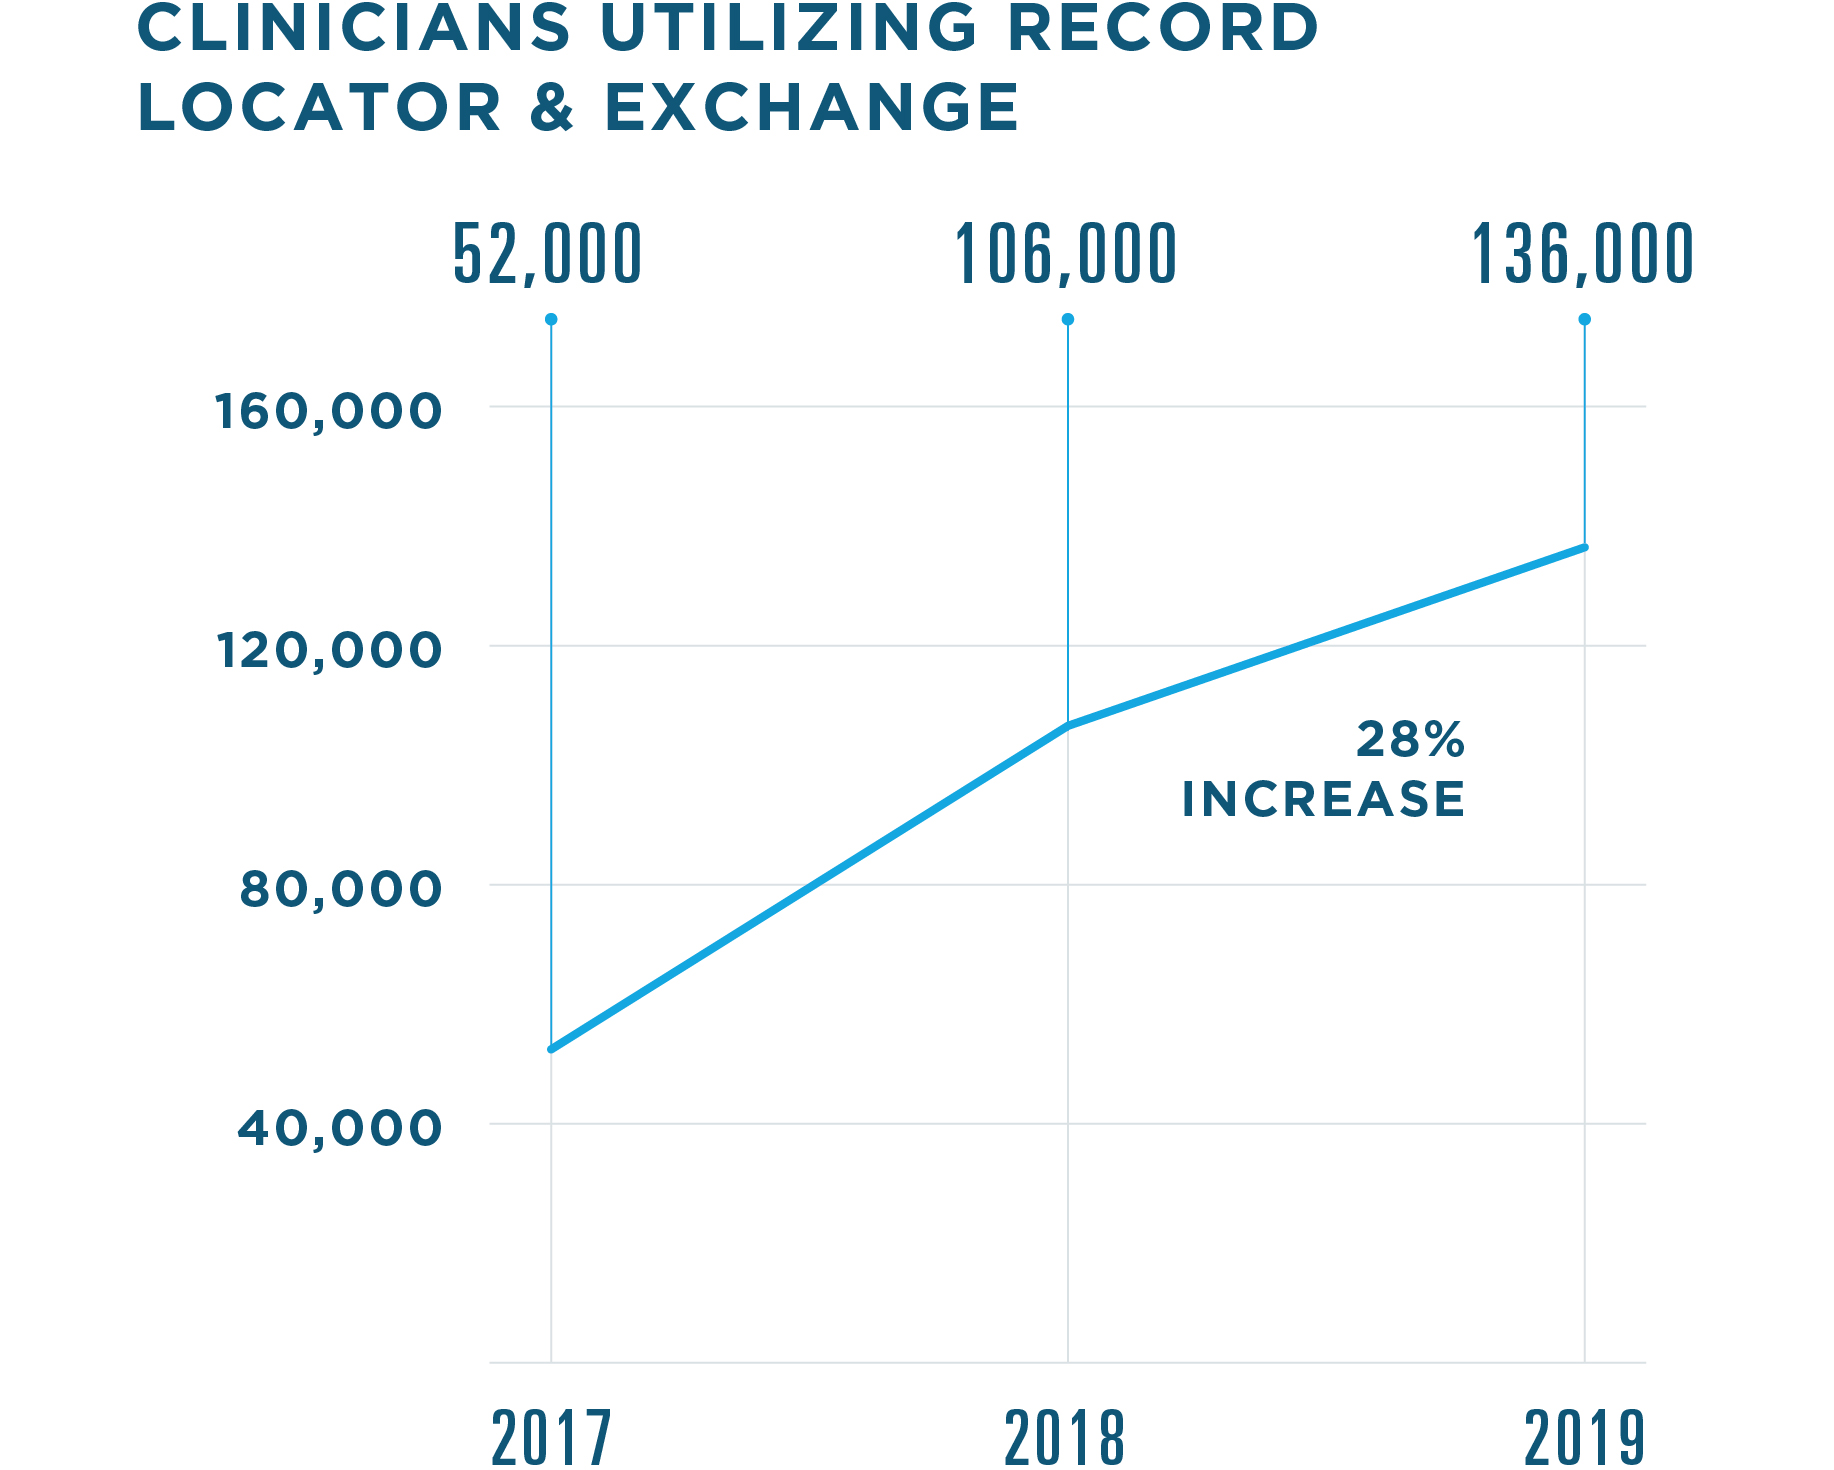
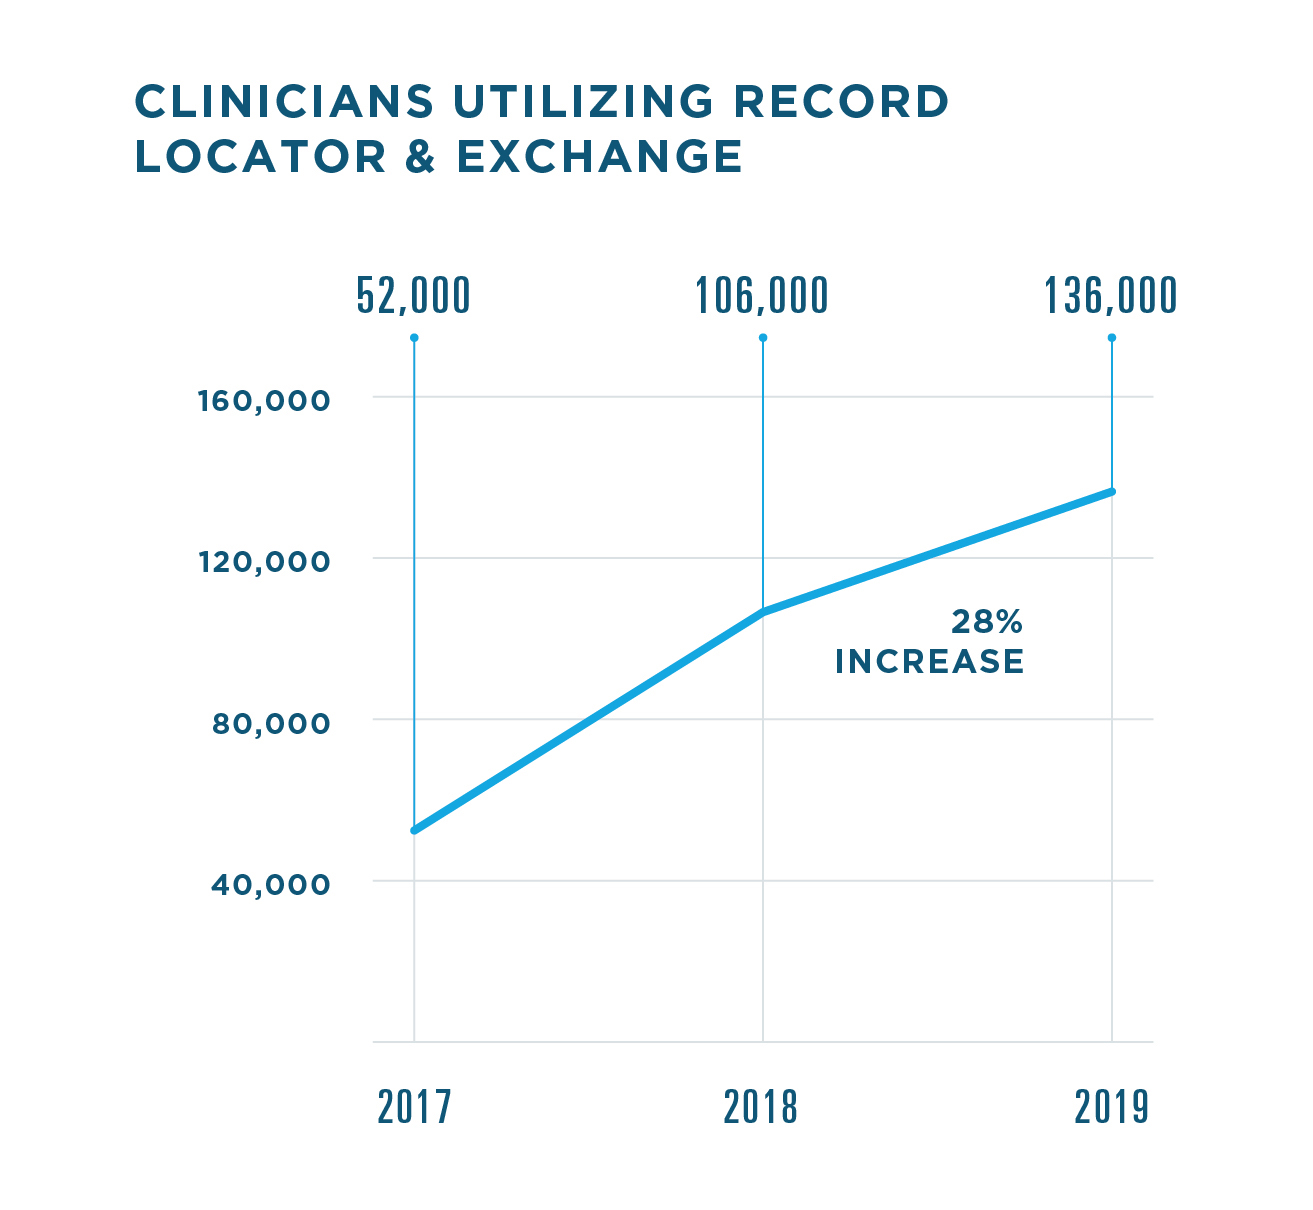
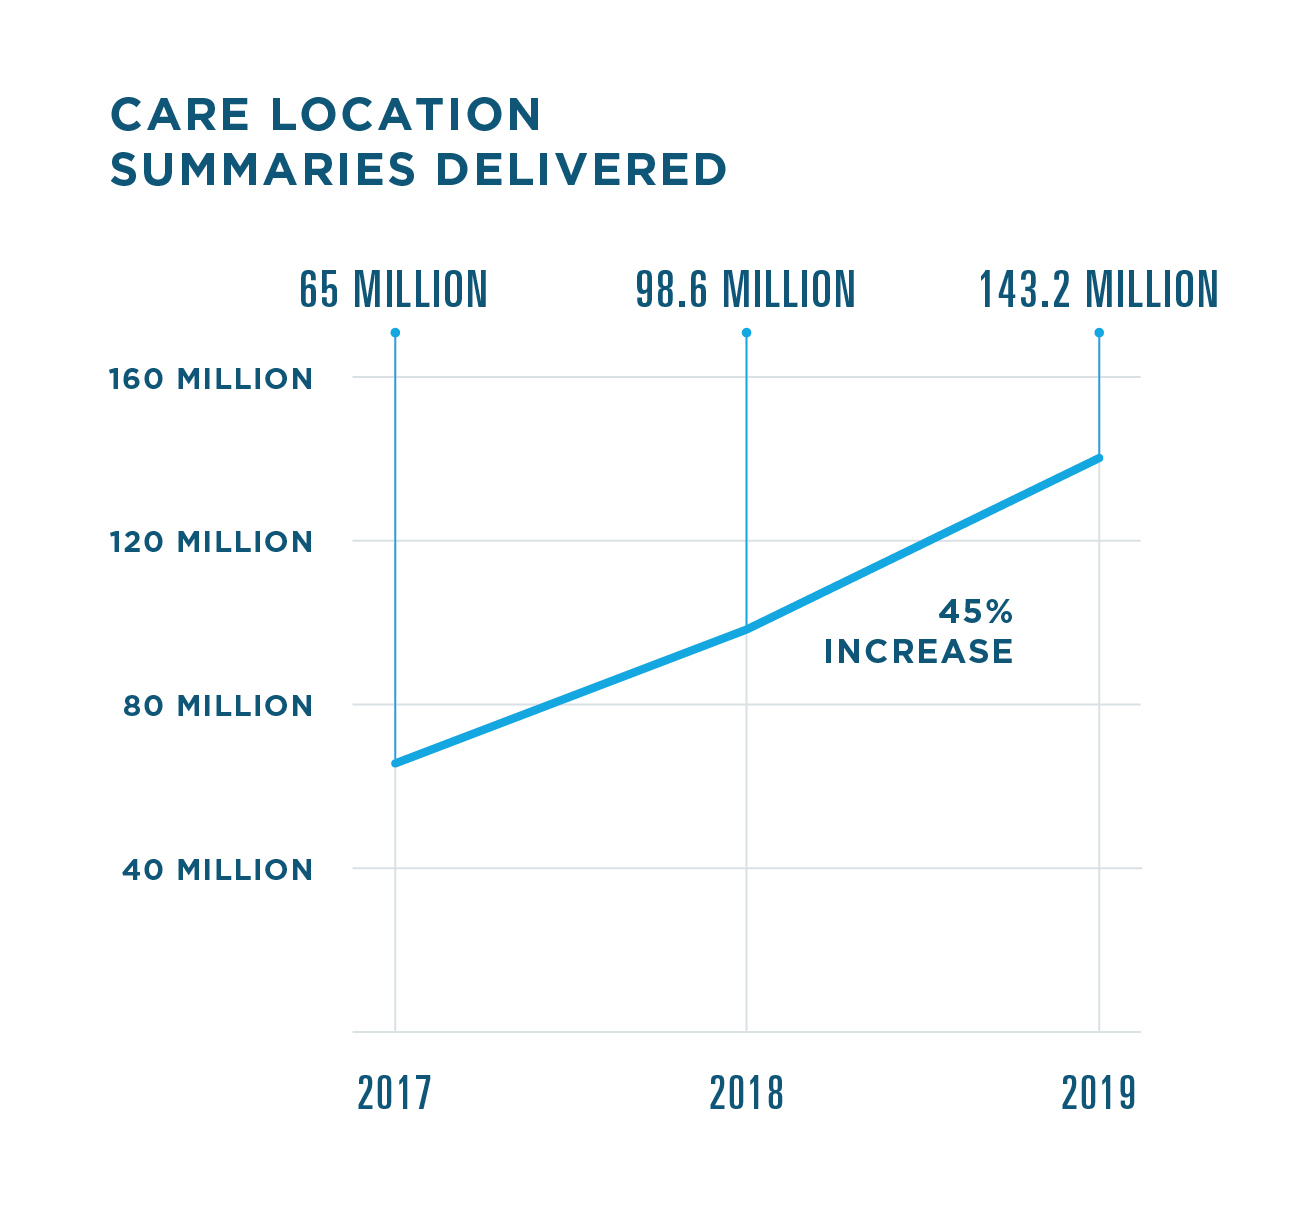
RECORD LOCATOR & EXCHANGE
Record Locator & Exchange played a key role in enabling interoperability in 2019, helping more clinicians and their patients benefit from more complete clinical histories during care episodes.
.jpg)
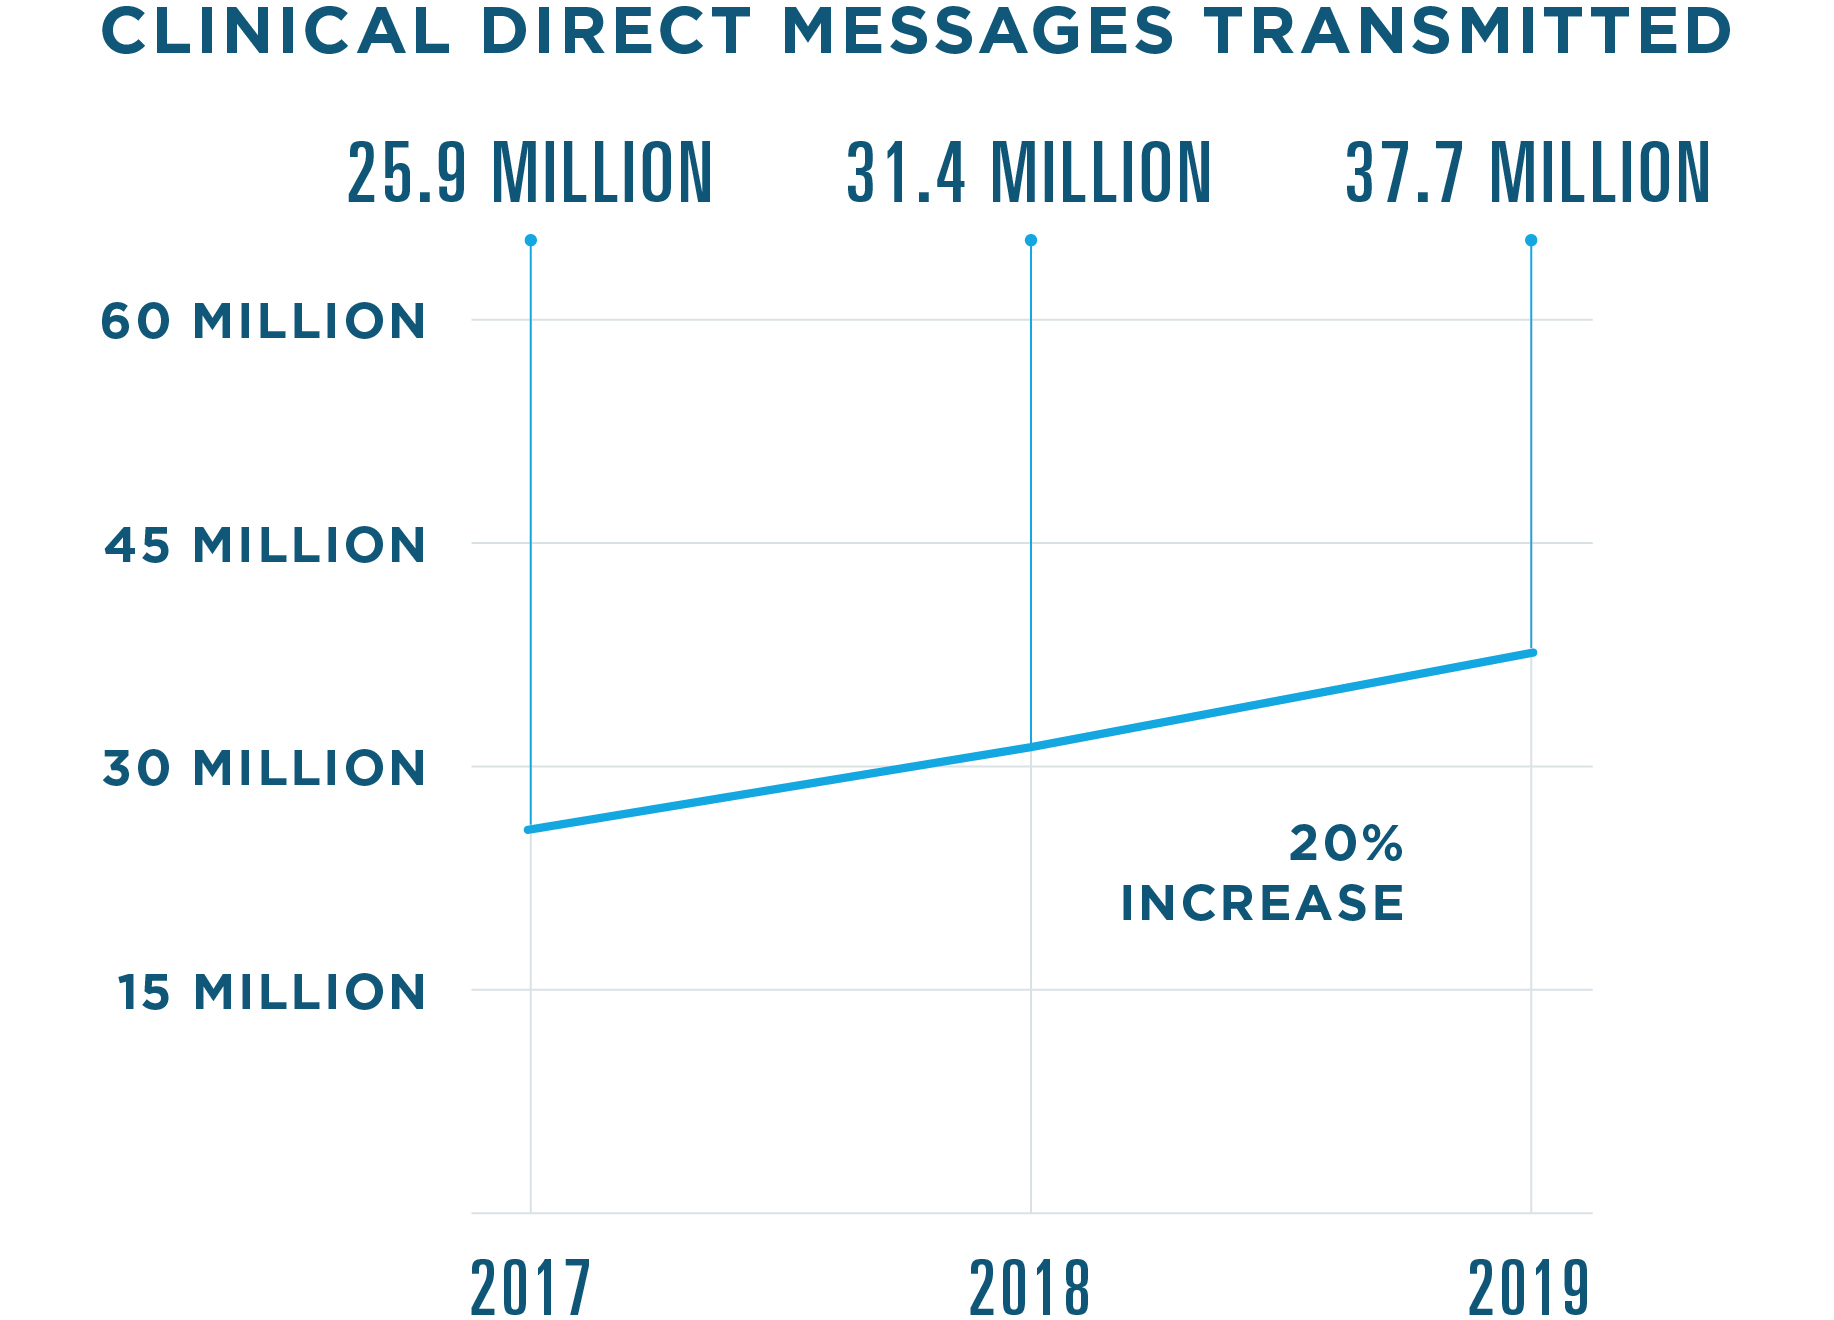
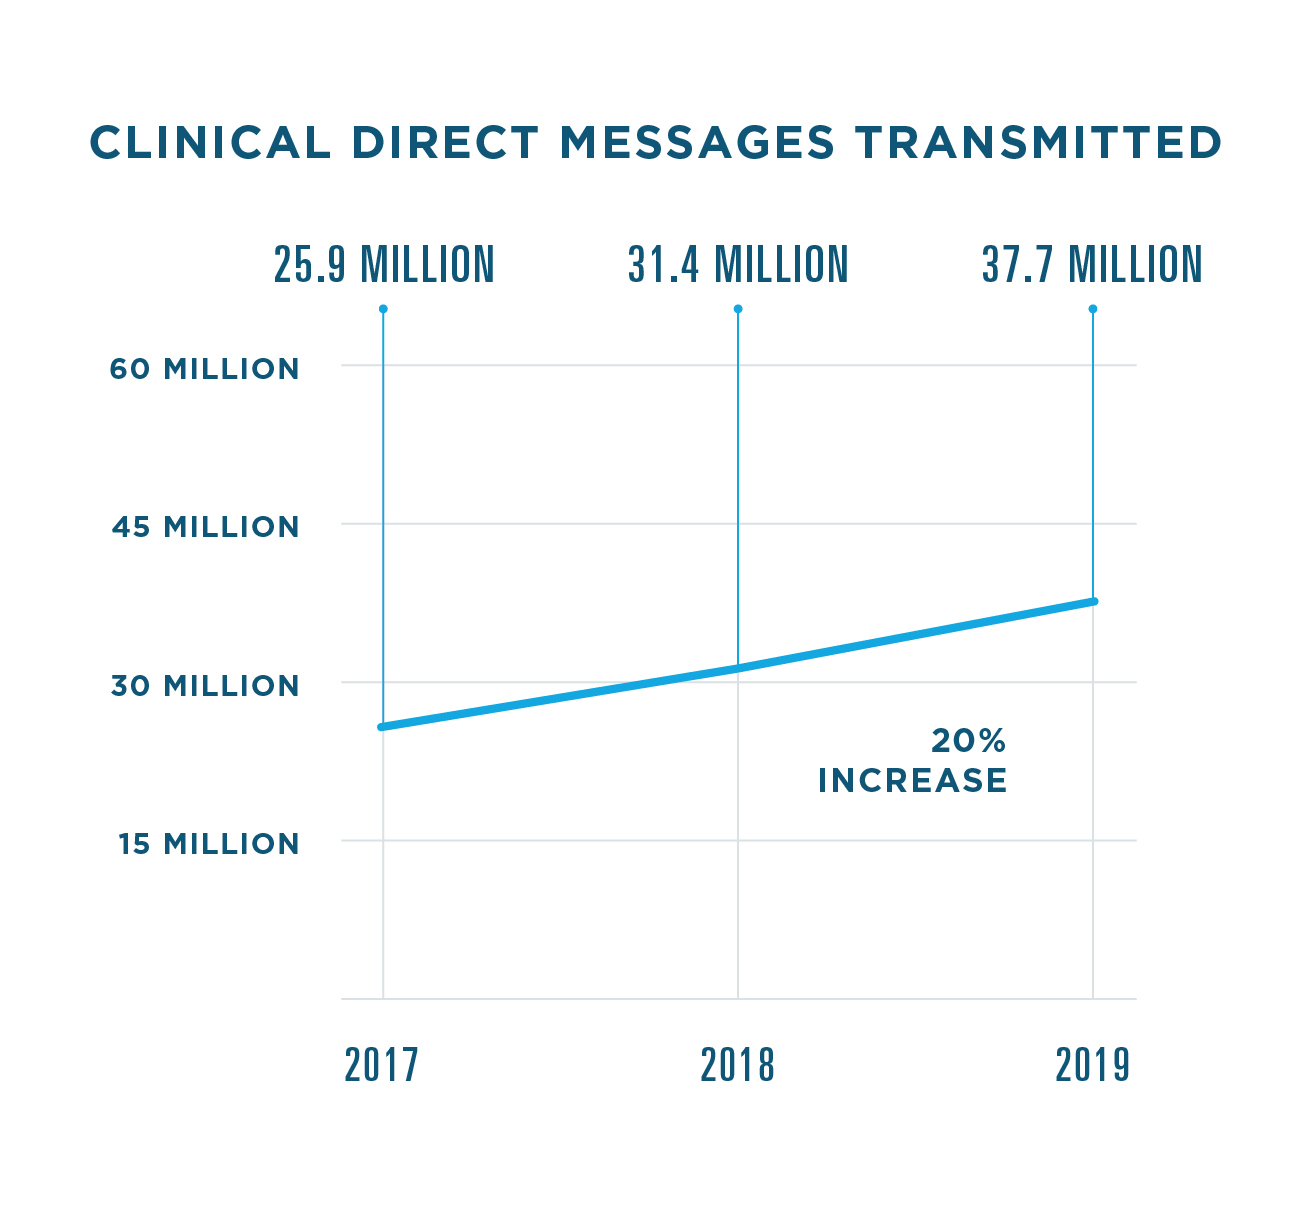
CLINICAL DIRECT MESSAGING
In 2019, the use of
Clinical Direct Messaging
expanded to include more individual users and new use cases. For instance, one PBM used Clinical
Direct Messaging to alert prescribers to formulary changes. Pharmacies used it to alert doctors when their patients received a flu shot at a pharmacy.
In total,
more than 648,000 individuals and organizations—including nearly
24,000 pharmacies—used Clinical Direct Messaging in 2019, a 9% jump from 2018.
INSIGHTS FOR MEDICATION ADHERENCE
Insights for Medication Adherence
provides patient insights with data from PBMs and others. For instance, if a patient filled prescriptions for opioid analgesics from at least three prescribers in the last 90 days, Insights for Medication Adherence could help clinicians recognize suspicious prescribing activity and intervene. It was also used to spot unsafe overuse of certain therapies, such as flagging a patient with a supply of benzodiazepines, muscle relaxants and opioids in the last 45 days.
In 2019, Insights for Medication Adherence supported
more than 120,000 clinical interventions.
ADVANCE HEALTHCARE
ADVOCATING FOR THE USE OF HEALTH IT
Working at the intersection of so many national healthcare issues gives Surescripts a unique opportunity to advance our collective knowledge through original research and data analysis. In 2019, we paid special attention to the role of EPCS in combating the opioid epidemic and opportunities to improve the process of prescribing specialty medications.
EPCS RESEARCH
With the SUPPORT Act requiring electronic prescribing for all controlled substance prescriptions covered by Medicare Part D by 2021, we’re seeing increased use of EPCS among Medicare Part D providers. We worked with the Office of the National Coordinator
for Health IT to study their
use of EPCS between 2015 and 2016.
During this time period, the proportion of all Medicare Part D prescribers using EPCS increased from 4% to 11% while Medicare Part D opioid prescribers using EPCS more than doubled, rising from 5% to 13%. Pain management specialists had the
largest proportion of EPCS utilizers, with 21% transmitting their controlled substance prescriptions electronically.11
The results of this research help us understand which areas of medicine and the country are seeing the most EPCS use and better forecast
its growth through and beyond 2021.
SPECIALTY PRESCRIBING RESEARCH
We entered 2019 well aware of the complexity of specialty prescribing, and further research illuminated the particular
challenges prescribers face when prescribing specialty drugs. We surveyed healthcare providers about their experience writing specialty prescriptions and identified two primary pain points: a lack of key information in drug selection and the burdensome manual prescribing process.12
On average, providers spend more than three hours a week on paperwork—not including charting—in order to start a patient on a specialty medication. The time and administrative burden has a domino effect: Nearly 40% of providers said it typically takes one to two weeks to actually get that medication to the patient.
Unsurprisingly, only 29% of providers are extremely or very satisfied with their organization’s efficiency when prescribing specialty medication. This inefficiency can also result in wasted work for pharmacies. When physicians encounter barriers to prescribing, two-thirds simply change or reroute their orders.
Taken as a whole, our research shows ample opportunity for improving how we handle specialty prescriptions, where the costs are often as high as the impact on patients’ lives. We are already incorporating these insights into the solutions we build, and we look forward to seeing statistics like these shift as better processes take hold across the Surescripts Network Alliance.
- Yuriy Pylypchuk et al., “State of Interoperability Among U.S. Non-federal Acute Care Hospitals in 2018,” ONC Data Brief no. 51 (March 2020).
- 2. Vaishali Patel et al., “Variation in Interoperability Among Office-Based Physicians in 2015 and 2017," ONC Data Brief no. 47 (May 2019).
- 3. Engine Group and Surescripts, survey of 502 U.S. physicians and nurses conducted in October/November 2018.
- Surescripts, "Prescription Price Transparency and the Patient Experience,” February 2020, p. 3.
- Aetna, "2018 Health Care Trends," February 20, 2018, p. 6.
- Humana, "Research Report: Value-Based Payment Readiness,” HMFA.org, March 31, 2018.
- "2019 Drug Trend Report," Express Scripts, accessed March 23, 2020.
- Abigail Zuger, “Nationwide U.S. Opioid Prescribing Trends,” ,” NEJM Journal Watch, March 14, 2019.
- Bridget Kuehn, "Declining Opioid Prescriptions," Journal of the American Medical Association 321, no. 8 (February 26, 2019): 736, doi:10.1001/jama.2019.0647.
- Cathryn Donaldson, "New Fast PATH Initiative Aims to Improve Prior Authorization for Patients and Doctors," AHIP.org, January 6, 2020.
- Christian Johnson et al., "Electronic Prescribing of Controlled Substances among Medicare Part D Prescribers 2015–2016," ONC Data Brief no. 44 (April 2019).
- Surescripts, "Provider Perspectives on Specialty Prescribing," April 2019.